Last updated: June 2026
High-performance Load and Simulation Testing for FMIs
th2-Loader (aka th2-shark) is a high-performance load and simulation platform for mission-critical financial market infrastructures (FMIs). Built for environments where microseconds matter and failures have a systemic effect, th2-Loader goes far beyond traditional performance testing tools. It enables organisations to detect capacity, resilience, correctness and recovery defects in trading, market data distribution, post-trade and web-based systems – as well as across systems – under realistic and extreme conditions and complex load scenarios.
Testing modes:
- load generation via multiple protocols
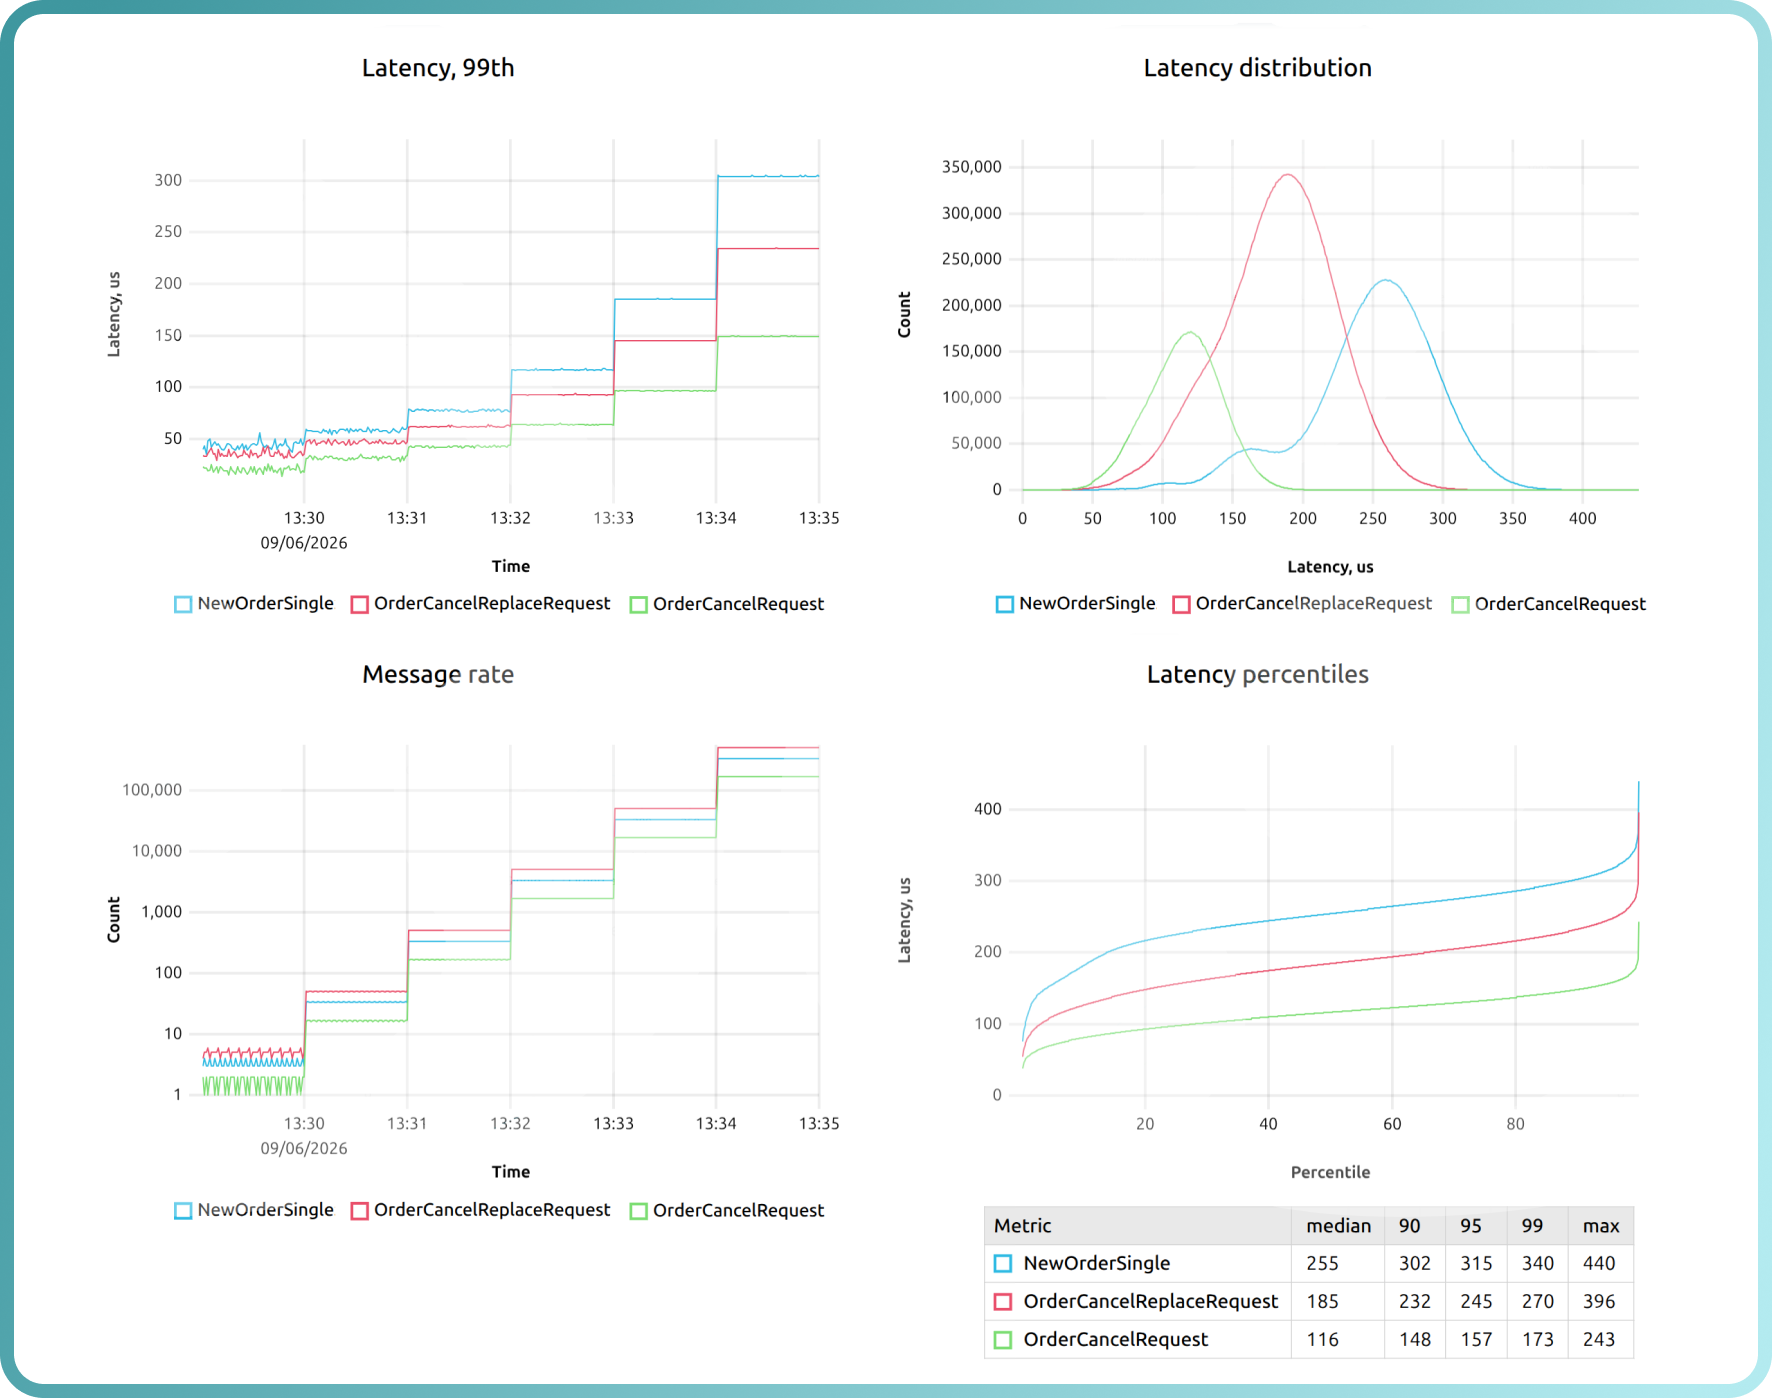
- real-time and post-execution data analysis
- event-driven load test scenarios
- functional testing
- comprehensive end-to-end testing via client/server simulation
- test or production data replay
- load generation via multiple protocols
- real-time and post-execution data analysis
- event-driven load test scenarios
- functional testing
- comprehensive end-to-end testing via client/server simulation
- test or production data replay
Advanced Load Control & Fault Testing
- Platform-agnostic within the financial domain and applicable to other domains, following additional customisation
- Thousands of simultaneous client connections or server simulation, high-rate transaction stress, bandwidth and latency measurement
- Configurable load shapes and messages mix per connection or group
- Dynamic on-the-fly load changes during execution
- Support for failover and fault-tolerance testing
- Built-in reconciliation features across multiple data streams and systems
- Support of a variety of financial and general protocols and APIs
- GUI testing capabilities
- Real-time exposure of general and custom metrics into a monitoring solution
- Dynamic reporting capabilities for internal and regulatory compliance purposes
th2-loader enables advanced capabilities for generating enterprise-grade loads alongside easy adoption across non-functional testing teams. It can be on-prem- or cloud-hosted and does not require high-end hardware for massive load testing.
Enterprise-grade load, performance and resilience testing for financial systems


Exactpro’s Alyona Bulda, SVP of Emerging Technologies, presented a paper ‘Beyond Message Injection: Advanced Load Testing Capabilities for Trading Systems with th2-shark’ at The 14th International Workshop on Load Testing and Benchmarking of Software Systems (LTB 2026). The workshop was co-located with ICPE 2026 – the 17th ACM/SPEC International Conference on Performance Engineering.
See enterprise-grade load testing in action
Discover how th2-loader can stress-test your systems
Technical Characteristics
- Capacity & Precision
- Capable of producing hundreds of thousands/millions of messages per second of sustained load and microbursts up to several thousand messages per millisecond. Microsecond-range precision.
- Testing Type
- Capable of acting in several modes: active load and non-functional testing (simulation of both client connections and/or server end points), reconciliation (comparison of different data streams), replaying of pre-recorded data. The tool follows user-driven logic for data sending/handling/reconciliation, so it can support custom scenarios/user-defined behavior.
- Target SUT
- Trading Platforms, Market Data Delivery and Post-Trade Systems and their combinations
- SUT Interface
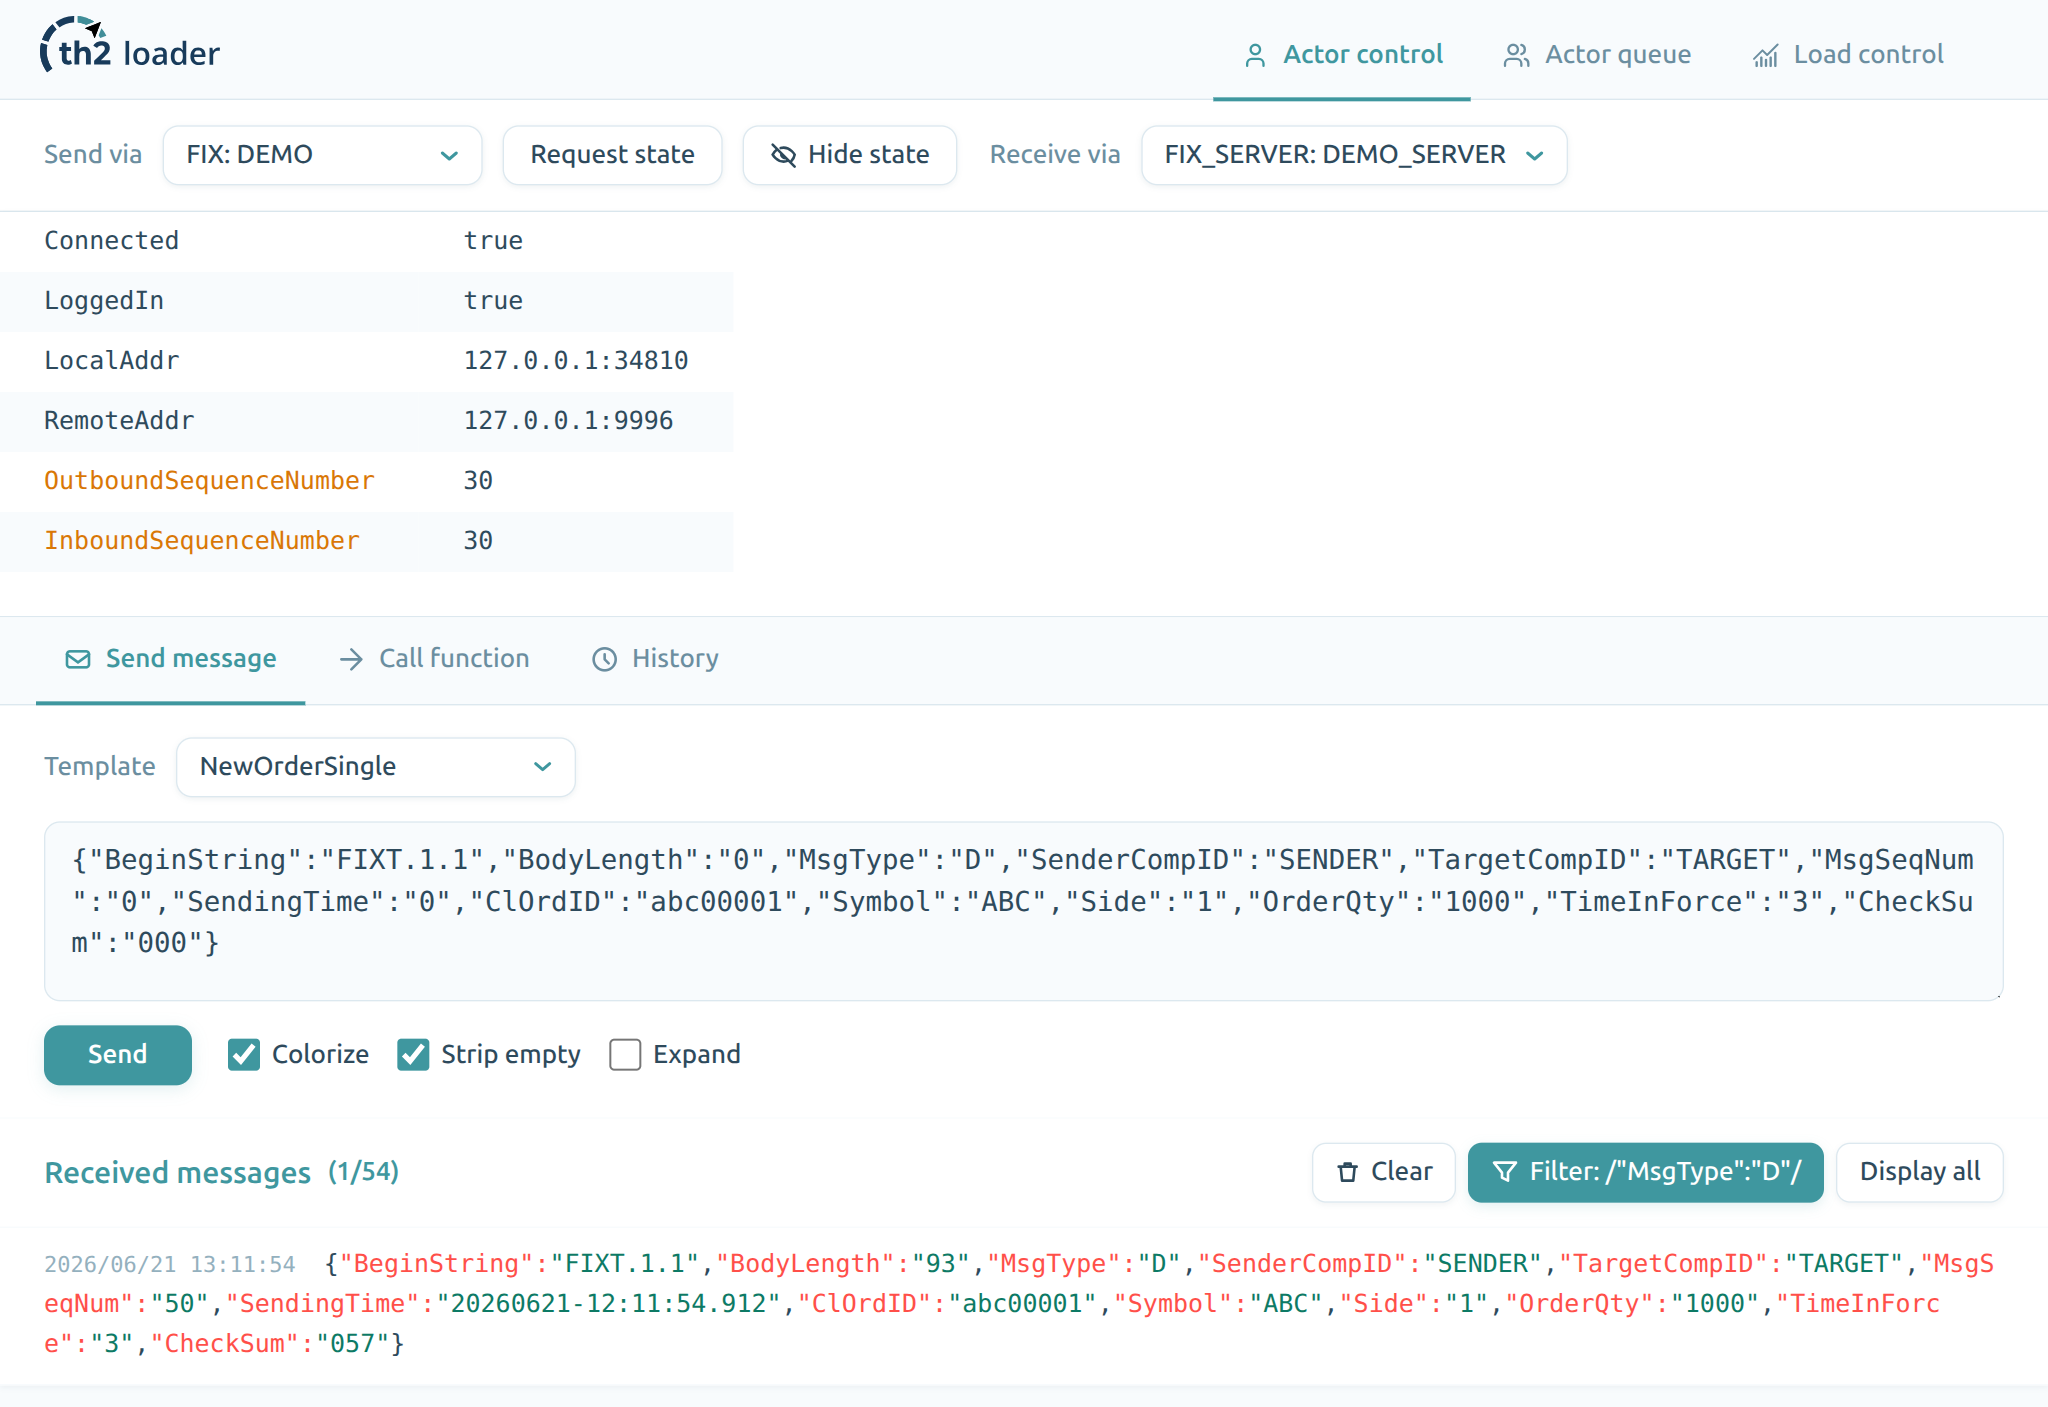
- The tool is able to simulate client connections (typically to gateways over network protocols/APIs; data streams generation: mcast/ucast), REST API, Websockets; has features to test a WebUI frontend.
Can simulate a server and handle connections from an SUT (e.g. post-trade feed or handle SOR (Smart Order Router) connections to away exchanges). As well as TCP, the tool is able to broadcast data in UDP and can be used for external pricing feed simulation (e.g. SIP or OPRA). - SUT Interaction Method
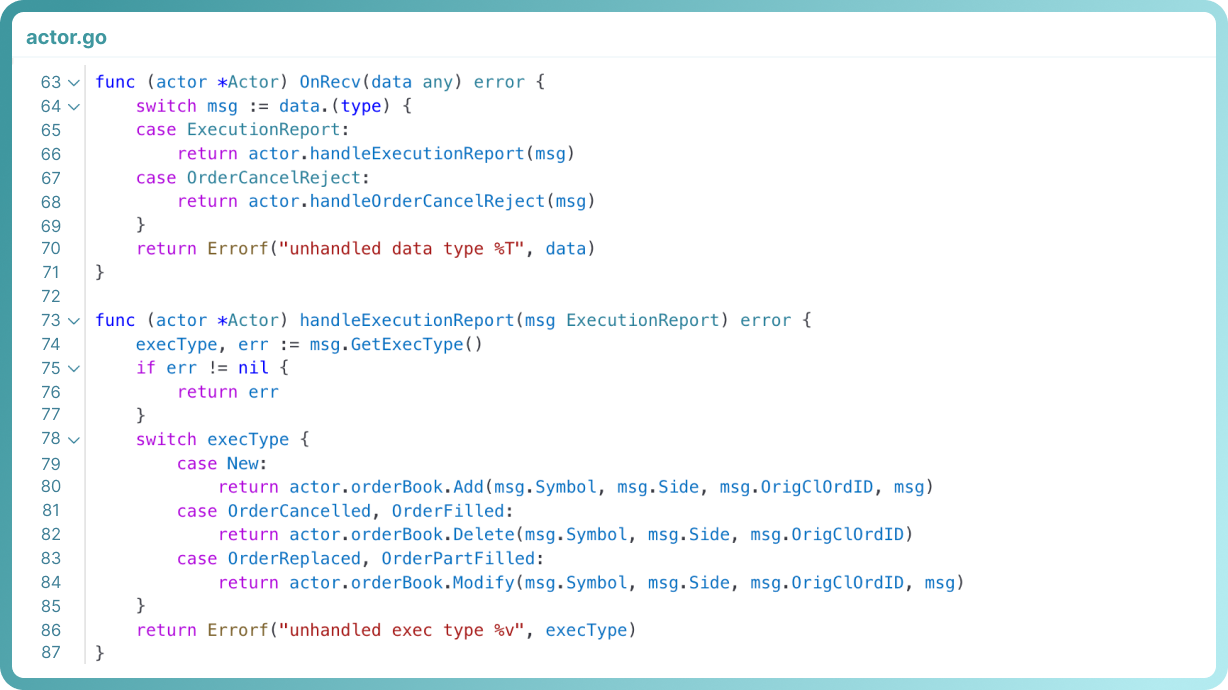
- The tool has a modular structure and has an ability to implement custom user-defined logic. Inputs and outputs are generated based on the user-defined logic, load shapes and other parameters. The tool supports ‘on the fly’ load shape changes.
- Protocols
- Extant plug-ins for Industry-standard (FIX and dialects, FAST, ITCH, etc.) and proprietary (MIT, OUCH, SQF, SAIL, HSVF, etc.) protocols. New bespoke plug-ins for additional protocols can be developed by request.
- Test Scripts
- Capable of stressing systems with a high rate of transactions, including microbursts. Used for throughput, bandwidth, latency tests. Can be used for support of fault tolerance (failover) tests. Has features for reconciliation of several data sources (e.g. input vs output, order entry vs market data, etc.).
- Test Management, Execution and Reporting
- Simulation of multiple client connections with specified load shape for each connection or group of connections (configure number of connections, Load Shape for each connection or group of connections, messages distribution for each connection or group of connections).
Can report metrics to Prometheus (or other monitoring system) and it can be visualised in Grafana (or similar tools) in near-real time. - Platform requirements
- Platform-agnostic. Mostly used on Linux-based 64-bit platforms.
Frequently asked questions
What is th2-loader (th2-shark)?
th2-loader (also known as th2-shark) is a high-performance testing framework written in Golang and developed by Exactpro. Engineered to deliver robust testing solutions for trading systems, exchanges, market data distribution platforms and post-trade infrastructures, the framework has a versatile architecture that extends well beyond traditional financial systems. It supports both functional and non-functional testing and is capable of generating throughputs of up to millions of messages per second.
What messaging protocols does th2-loader support?
th2-loader supports a wide range of industry-standard protocols, including FIX (all versions), ITCH and OUCH, alongside proprietary exchange protocols such as MIT, SAIL, HSVF and SQF. Its extensible architecture also allows for the development of custom protocols on request.
What differentiates th2-loader from other tools?
Unlike highly specialized tools that focus primarily on web API load testing, th2-loader delivers high extensibility to meet diverse and evolving system requirements. This adaptable approach helps organisations optimise their testing workflows, which results in reduced operational costs and faster deployment cycles.
Where can th2-loader be deployed?
Deployment options for th2-loader include both on-premises and on-cloud environments without requiring high-end hardware even for massive load testing. The end-user solution is usually delivered as a statically compiled binary for the specific OS and architecture.
What are the most common use cases?
th2-loader is actively used to build complex testing solutions for financial market infrastructures requiring high throughput, low latency and diverse test data. The solution can simulate thousands of concurrent users, such as traders, market-makers and market-data consumers. It can seamlessly act as an external data feed or stub all required endpoints for comprehensive end-to-end testing.
What is the maximum load th2-loader can generate?
th2-loader generates up to millions of typical trading messages per second updating data in-flight even from a standard mid-range laptop.
Is th2-loader configurable?
While shipped with sensible defaults, th2-loader is a highly configurable framework. End users can easily change the load profile and test user parameters, as well as adapt every core component to their needs.
Does th2-loader integrate with other tools?
Out of the box, th2-loader supports native metrics reporting to Prometheus, allowing seamless integration with monitoring solutions like Grafana. Additionally, it features an HTTP API that enables full remote control and dynamic code execution.