
Get full case study & brief overview in PDF
Executive Summary
This case study is a collaboration between Connamara Technologies, the leading provider of financial marketplace infrastructure, and Exactpro, an independent software testing, development and consulting services specialist serving financial market infrastructures globally, that follows Connamara Technologies engaging Exactpro as an independent testing provider for EP3® in March 2026.
EP3® is a high-performance platform that powers exchanges and clearinghouses worldwide, supporting trading across traditional and emerging asset classes. A fully-integrated end-to-end platform, EP3 offers 24/7 operational capability and extensible customisation options to accommodate a wide range of new and existing fintech marketplace use cases.
By introducing an independent testing partner, Connamara Technologies aimed to further strengthen EP3’s robustness, scalability and operational resilience, while independently validating the system’s non-functional characteristics using production-like workloads and established performance assessment practices. To carry out this task, Connamara Technologies sought an objective, technologically sound, enterprise-grade and venue-sensitive software testing approach with robust reporting capabilities able to support customer evaluation, capacity planning, reporting and compliance needs, and inform the next stage of EP3’s evolution.
The case study describes Exactpro’s proprietary testing approach used for EP3 and focuses on the methodology behind the comprehensive measurements of system latency, capacity and throughput. The case study also aims to disambiguate some of the metrics used in the industry to competitively position trading venues and technology provider solutions based on their non-functional characteristics. A wide range of financial technology operators and other stakeholders involved in delivering mission-critical systems can use this approach as a reference resource.

James Downs
CEO, Connamara, Connamara Technologies
‘By engaging Exactpro, a leader in financial market infrastructure testing, we knew we would obtain an unbiased evaluation of the non-functional characteristics of EP3. In doing so, we have added a level of credibility and transparency to the throughput and latency profile of EP3 that few other vendors have.’

Pavel Medvedev
Head of Non-functional Testing, Exactpro
‘A benchmark is only as credible as the methodology behind it. Our objective as an independent software testing services provider on this engagement has been to ensure that objective non-functional testing benchmarks are obtained under transparent, repeatable conditions using representative workloads, consistent measurements and comprehensive functional reconciliation. Such an approach enables trading venue operators to make infrastructure and capacity decisions based on evidence they can trust.’
The Challenge
As trading volumes grow and markets move towards 24/7 operation, trading venues and clearing organisations need technology that can maintain performance, remain resilient under stress and continue to process transactions correctly. They also need to demonstrate these capabilities through robust testing and measurement. At the same time, established and emerging venues are looking to adopt new asset classes and expand into new markets more quickly. This makes objective, comprehensive evaluation of system performance and resilience an increasingly important part of technology decision-making.
As a marketplace infrastructure platform designed to support a broad range of asset classes and trading venue models, EP3 must accommodate diverse functional, performance, operational and regulatory requirements. Its high degree of configurability also means that its behaviour needs to be evaluated across different operating conditions. To support EP3's continued evolution and further reduce operational risk, Connamara Technologies engaged Exactpro as an independent software testing specialist to assess the platform's functional and non-functional behaviour and establish reliable performance benchmarks for a core EP3 configuration. An important object of testing activities needed to be the interaction between functional and non-functional system characteristics (functional correctness under load), to ensure production-like testing conditions.
Why methodology matters
When demonstrating performance, venues may use a variety of metrics, with one often-quoted number being ‘orders per second’ (or ‘ops’). As a standalone number, this metric can introduce ambiguity, as ‘orders per second’ can potentially imply ‘new orders’ or also include order ‘replaces’, ‘cancels’, ‘mass cancels’, ‘mass system uncrossing events’, ‘RFQs’, ‘quotes’ or ‘trades’. The quoted benchmark could consist entirely of simple order entries or include a variety of modifications, cancellations and executions. These options represent vastly different computational workloads. In addition, published metrics do not always determine if they apply to matching-engine-only throughput or full-system throughput. In the case of ‘end-to-end’ throughput, it is not always clear what the exact endpoints are.
‘Orders’ may also refer to ‘messages’ containing from one to hundreds of orders each. In this case study, alongside 'orders per second', we also use 'messages per second' (‘mps’) to express the load we generate in these units. While an ‘order’ is usually understood as a business object, a message is a countable unit of work at a defined protocol boundary, which makes it a more accurate unit of technical workload. Beyond order entry, cancel and replace requests, production-like load would also include session-level messages, market data requests and other ‘non-order’ traffic. The ‘mps’ metric thus reflects the precise volume of protocol-level activity. However, to make this metric more meaningful, it is necessary to disclose the composition of the message mix alongside every reported figure and hold that mix constant across runs.
How performance is measured matters as much as the load the system endures. This makes the underlying methodology used to obtain the numbers a critical aspect in approaching non-functional testing and benchmarking. A recommended approach should feature production-representative traffic that accounts for upstream and downstream dataflows, includes varying workload shapes and guarantees measurement integrity. In this case study, we set out to describe the non-functional testing and benchmarking approach that was used for the Connamara Technologies’ EP3 platform.
About EP3®
 EP3® is an integrated asset-agnostic exchange, clearing and market surveillance platform. Its core capabilities include order matching, market access, risk management, market surveillance, clearing and settlement and reporting. The platform is modular, API-extensible and cloud-native. The matching, clearing and surveillance components can operate independently or together. EP3 can be deployed across cloud, hybrid and on-premises environments; it is designed to support 24/7 operations. The platform offers FIX, websockets, Binary and RESTful APIs, giving exchange operators a range of options for customer integration for order routing and market data collection and dissemination.
Learn more about Connamara Technologies and EP3 at https://www.connamara.tech/the-platform/.
The choice of independent testing services provider
 In mission-critical systems that underpin capital markets infrastructure, separation between development and testing functions supports objective assessment of system performance, functional integrity and operational readiness, while also helping identify edge cases, race conditions and other hidden interdependencies – issues that may not emerge during more targeted, less integrated testing activities. In over 17 years of facilitating some of the industry’s most complex technology transformations across global jurisdictions and venue types, Exactpro has earned a reputation of software testing excellence, deep business domain knowledge and operation in alignment with requirements and principles associated with regulatory frameworks and broader expectations around resilience testing, capacity management and incident preparedness.
Learn more about Exactpro services at exactpro.com.
The Solution
Designing the test approach
Engaging an independent software testing specialist provided a way to have the EP3 platform exercised under demanding production-like conditions while objectively evaluating its throughput, latency, daily transactions capacity and resilience. To achieve the testing objectives and comprehensive test coverage of EP3, the approach applied by Exactpro included a combination of functional and non-functional testing of the agreed-upon configuration of EP3 (as shown in Figure 2). Conducting functional testing enabled the independent testing team to gain a deep understanding of the platform and contribute to improving some of its operational characteristics. This allowed Exactpro to better adapt non-functional testing scenarios to production-like workloads and ultimately obtain metrics that Connamara Technologies development and business teams can benchmark against and use for a range of internal and external purposes.
Configuration under test – main EP3 components
EP3’s modular architecture, deployment flexibility and support for continuous exchange operations have placed testing objectives at the intersection of functional workflows, interoperability, scalability, resilience and sustained high-throughput performance. Validation activities had to account for diverse integration protocols, trading volumes, reference data setup, numbers of partitions, gateways, positions, position risk and other parameters, as well as deployment-specific behaviour across cloud, hybrid and on-premises environments – configuration preconditions that introduce sets of new variables and tuning characteristics. The lifecycle of all message types available in the system was used as a basis for testing.
Prior to starting the main testing programme, the testing team conducted exploratory testing (Figure 1) to establish an optimal EP3 configuration and execution baseline to ensure that the obtained results are repeatable and representative of the required type of production environment.

Figure 1. The testing workflow for establishing the execution baseline
Throughout the optimisation process, the benchmark methodology, workload profiles, measurement points and reporting approach remained unchanged. This ensured that improvements reflected genuine changes in platform performance rather than differences in test conditions. The high-level architecture of the EP3 configuration under test is shown in Figure 2.
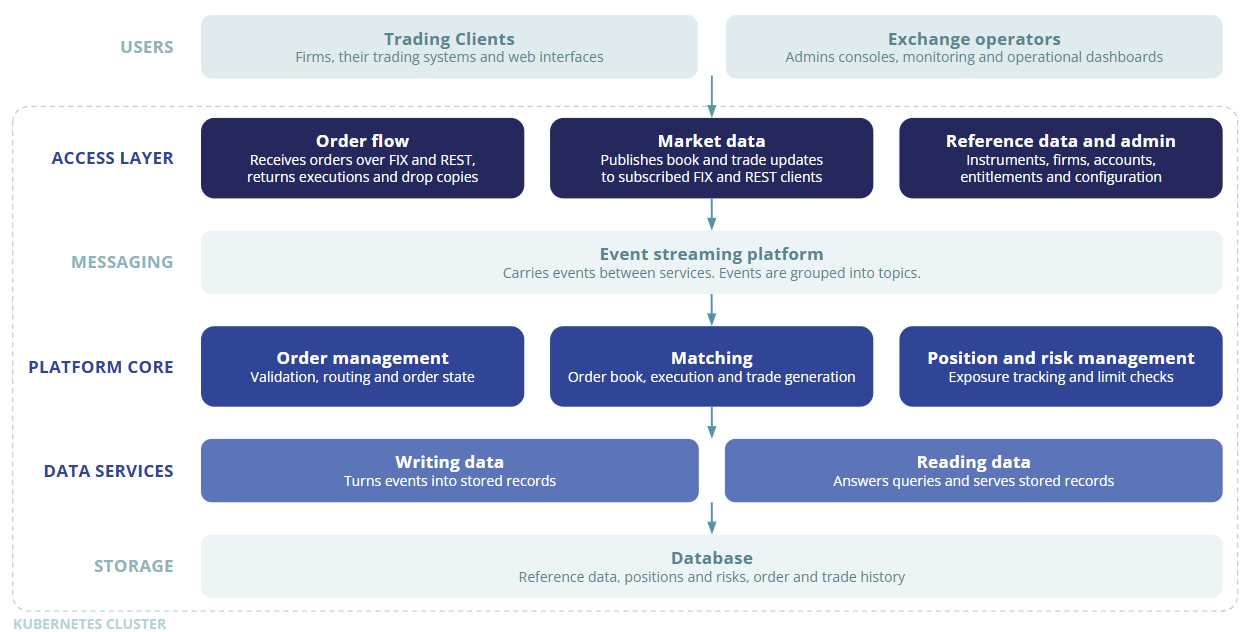
Figure 2. Architecture overview of the EP3 platform under test
Functional testing scope
The functional testing activities (see the functional testing workflow outlined in Figure 3) contributed to reducing operational risk associated with the platform’s evolution by introducing independent validation, building repeatable test coverage and consolidating testing assets into an executable and reusable test library. Particular emphasis was placed on establishing reliable baseline metrics for future platform development and assessing the platform’s behaviour across realistic end-to-end exchange workflows, including operational edge cases. The functional testing approach relied on system modelling (creating a digital twin of EP3).
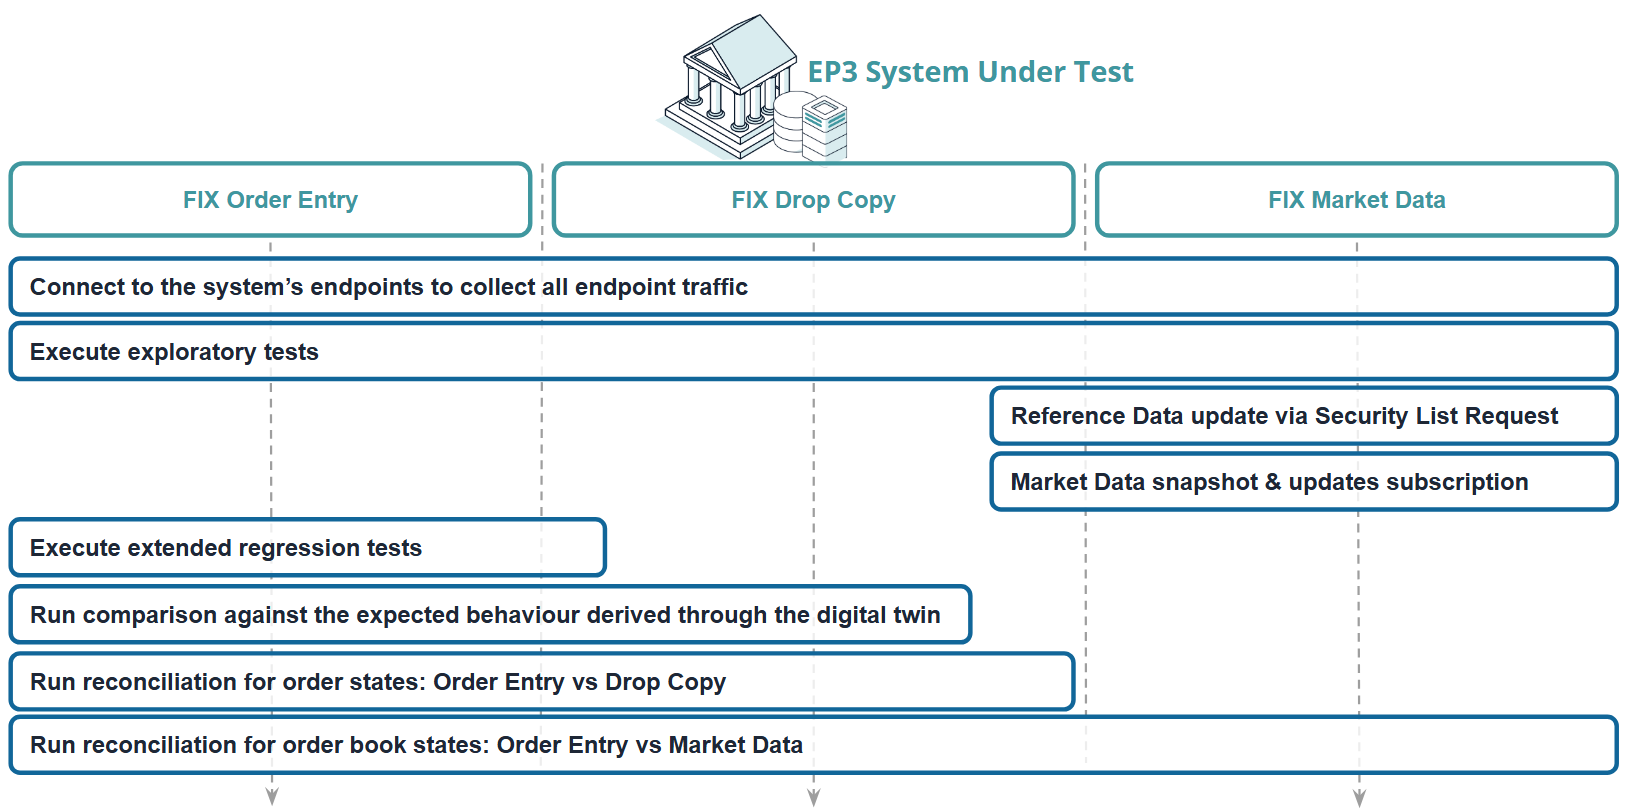
Figure 3. Functional testing workflow for EP3
The scope of functional testing (as seen in Figure 3) included:
- Session Level Management: Order Entry, Drop Copy, Market Data
- Error handling via Order Entry, Drop Copy, Market Data
- Business Logic: matching engine functionality (core and extended, auctions, Requests for Quote (RFQs))
- Drop Copy dissemination
- Market Data static and real-time updates
- Daily Life Cycle (DLC) and instrument state transitions and life cycles, trading schedules
- Reconciliation testing between the system end points for consistency validation
Non-functional testing scope
System performance is highly dependent on several configuration parameters, including the reference data and other load configurations, the number of gateways, users per gateway, the number of partitions in both the gateways and the distributed event streaming platform, as well as the number of positions in the system.
Performance benchmarking followed a measure–analyse–optimise–validate cycle. Baseline measurements established the initial system characteristics, subsequent analysis identified opportunities for improvement, and each optimisation was independently verified through repeatable testing before being incorporated into the final benchmark results.
Non-functional testing covered the following areas:
Load shape and resilience
- Burst tests – a steady baseline load with periodic spikes of increasing size, run at both 1-second and 5-second spike durations. These measured the peak latency reached during each spike and how quickly latency returned to its pre-spike level afterward.
- Recovery after overload – how long the platform takes to drain the accumulated backlog and return to normal once the excess load is removed.
- Session resilience under load – behaviour of FIX sessions while the platform is under load: heartbeat handling, acceptance of new logons and whether existing sessions are dropped.
Capacity and endurance
- Daily transactions capacity test – sustained message injection at a fixed rate to establish how many transactions the platform processes end-to-end without failure, plus a separate test run continued until components began to fail.
- Resource utilisation profiling – CPU, memory and storage consumption of platform components during a test run and after it completes, including whether utilisation returns to its baseline.
Configuration and methodology
- Configuration and tuning exploration – a large series of comparative test runs to establish the optimal configuration and to isolate which settings genuinely affect latency: partition counts, gateway counts, reference data volume, write caching and network/CPU/IO tuning.
- Network baseline measurement – the client-to-server network component measured independently from Transmission Control Protocol (TCP) handshake timestamps captured with tcpdump and used as the baseline for separating network time from platform processing time.
- Environment comparison – the same test suite executed on constrained bare-metal infrastructure and on the target cloud environment.
Test environment setup and approach
The test environment setup and main components of the overall test approach used for EP3 are shown in Figure 4. Moving beyond the high-level view of the approach, we further focus on a more detailed description of the non-functional testing methodology applied to EP3.
As stated earlier, non-functional testing of high-performance trading systems requires more than measuring distinct parameters, such as peak throughput, in isolation. It combines realistic workload simulation, performance benchmarking and resilience testing to understand how a system behaves under different operating conditions. The tests developed for EP3 used a representative central limit order book workload – with a mix of order types and time-in-force instructions as well as other parameters based on proprietary heuristics and industry-aligned practices – designed to exercise different order-processing paths.
As part of the approach, Exactpro utilised the th2-loader (th2-shark) load and simulation platform together with latency analysis, real-time monitoring and post-test reconciliation. This allowed performance metrics to be measured consistently while verifying if the system continues to behave correctly under load.
Monitoring stacks (from both the test tool and the system under test points) allow deeper insights into the system behaviour under load. The test approach was thus designed to work in conjunction with the existing monitoring solutions to provide a more complete view of how the applied load correlates with resource utilisation, latency, throughput and other system-level indicators.
The remainder of the case study elaborates on the non-functional testing methodology for latency, sustained throughput and capacity measurements – a critical aspect of non-functional benchmarking in high-performance trading systems, where even microsecond-level differences can significantly impact competitive positioning.
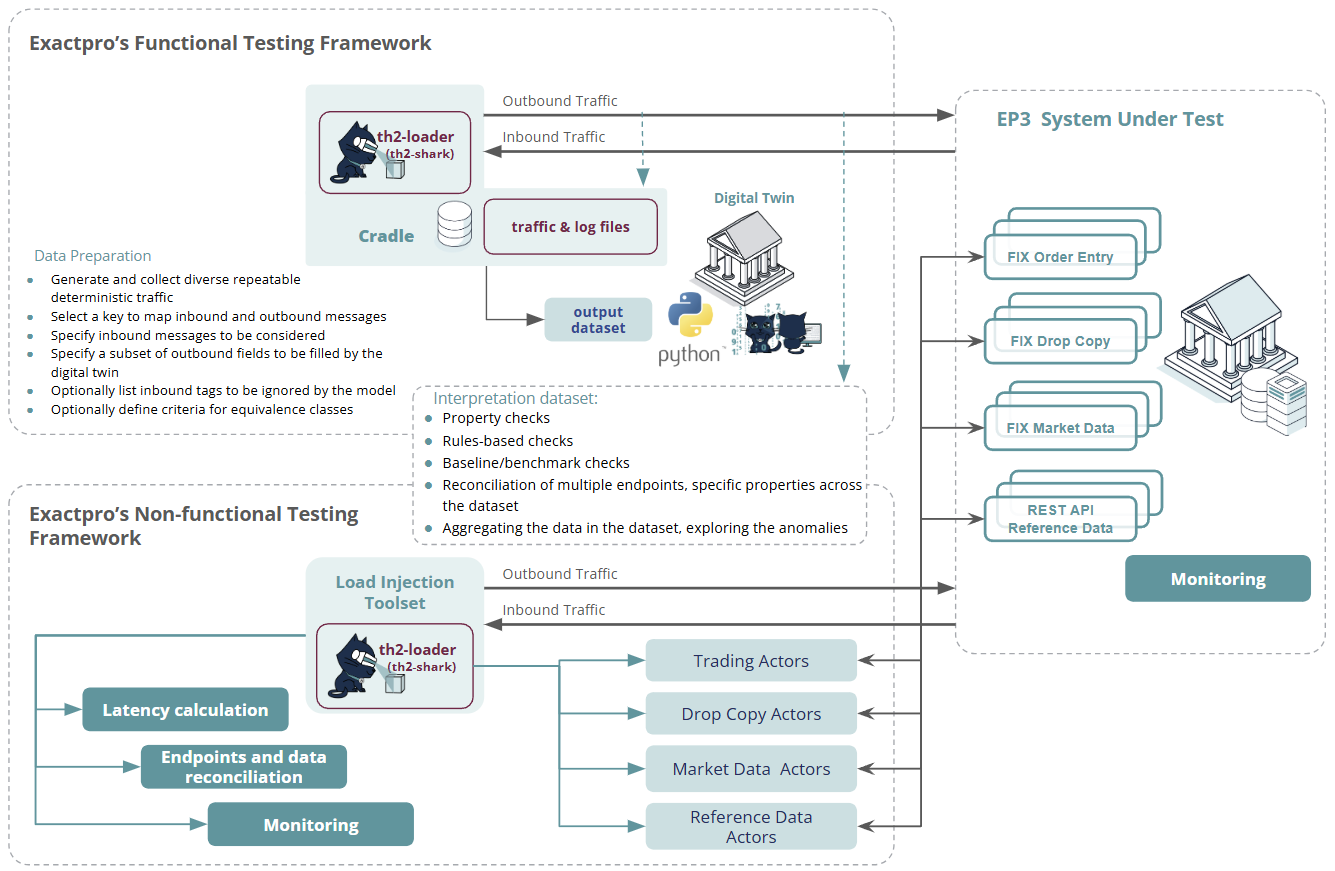
Figure 4. Aggregate view of the test environment setup and approach for EP3
Non-functional tests load composition
Disclaimer: specific values presented throughout this case study are not directly related to any particular system; however, the same testing parameters and measurement methodology were maintained across test iterations to ensure a meaningful comparison of the results.
All non-functional tests shared the same agreed-upon reference data and architecture configuration designed to reflect realistic message flows.
Data scale

Instruments
[thousands]

Firms
[dozens]

Positions
[thousands]
Users per channel

Order Entry
[dozens-hundreds]

Drop Copy
[dozens-hundreds]

Market Data
[dozens-hundreds]
Configured and running gateways

Order Entry gateways
[dozens]
Market Data gateways
[dozens]
Load composition encompassed a mix of message types (see Figure 5), order attributes and depth (see Figure 6) distribution used across the test runs. The trade ratio achieved with the specified message type mix is ~10% (i.e., 8-10 orders out of 100 get traded).
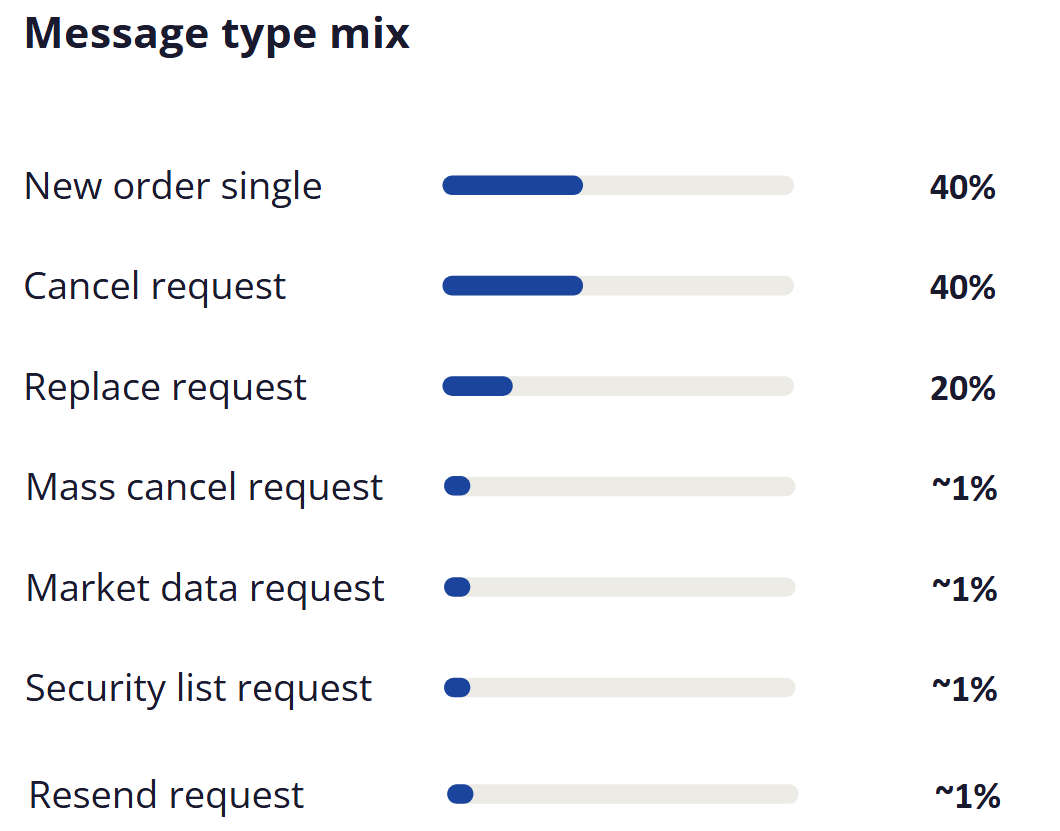
Figure 5. Mix of message types used for non-functional testing and benchmarking
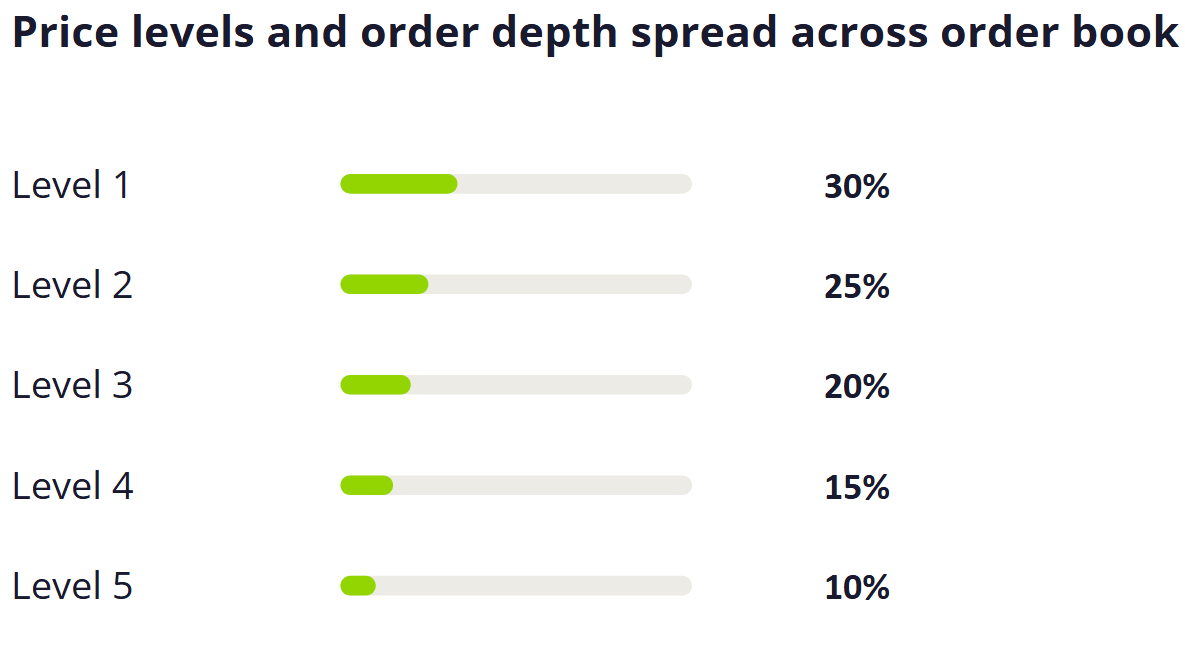
Figure 6. Price levels used in non-functional testing and benchmarking
For capacity tests, a more diverse load test configuration was used, as seen in Figure 7:
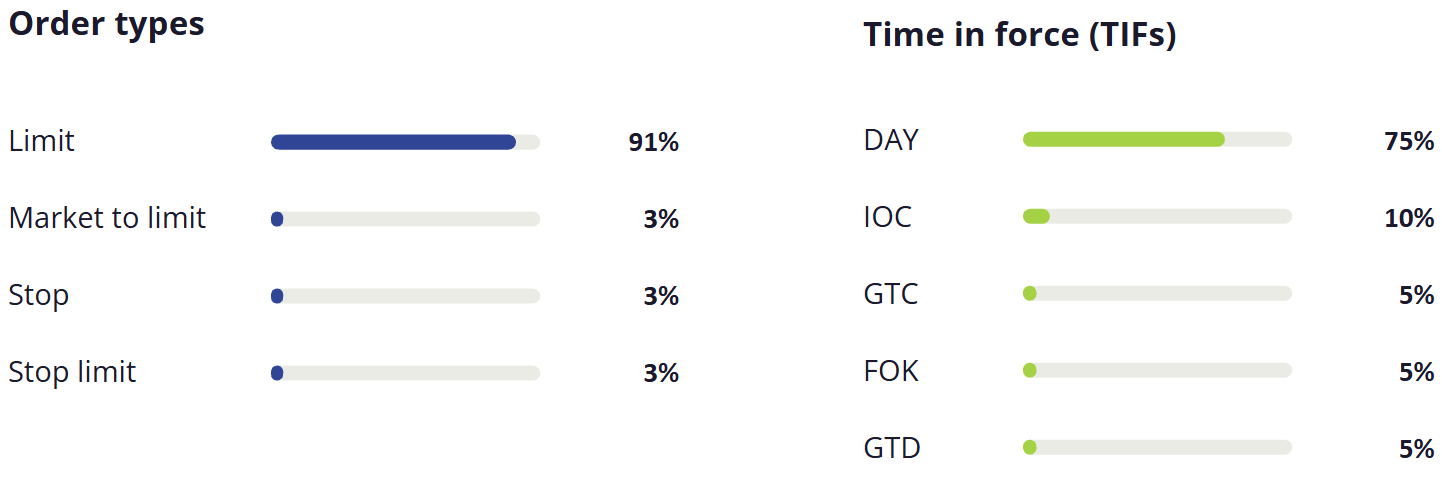
Figure 7. Capacity test configuration
Latency measurement points
The approaches to latency calculation may vary by measurement points and message types involved. The following latency types were measured during the engagement:
- Order round-trip latency – the time from submitting an order to receiving the corresponding execution report. The metric is reported as median, minimum, average, 95th, 99th and 99.9th percentile, and maximum.
- In-system latency – round-trip latency with the measured network component subtracted, leaving the platform's own processing time. The network figure is derived from TCP handshake pairs (SYN / SYN-ACK) timestamped by tcpdump at packet level, so it is measured rather than estimated.
- Order-to-market-data latency – the time from submitting an order until the resulting book or trade update reaches market data subscribers.
- Execution-Report-to-market-data latency – the time from the generation of an Execution Report until the resulting book or trade update reaches market-data subscribers.
- Latency by message type – round-trip latency reported separately for New Order, Amend and Cancel requests, and for trade confirmations, rather than as a single blended figure across the whole message mix.
- Latency distribution – the full spread of results across a run, grouped into latency buckets and plotted along the test timeline, rather than summary statistics alone.
Latency sensitivity
The measurements above were repeated while varying one factor at a time:
- Message rate (orders per second)
- Load profile – steady-state vs ramp-up
- Number of active Order Entry, Drop Copy and Market Data users
- Number of Order Entry and Market Data gateways
- Reference data scale – instrument count and position count
Throughput and capacity limits
- Knee point – the load at which latency stops scaling linearly and begins to climb sharply.
- Saturation point – the load at which the system can no longer keep up with the offered message rate.
- Peak sustainable throughput – the highest message rate the system handles without degradation.
Calculating and reporting latency metrics
Latency figures presented by technology operators/vendors to indicate performance are only meaningful when the measurement being reported is clearly defined. Different latency measurements capture different stages of the transaction lifecycle, while different statistical measures describe different parts of the resulting latency distribution. Figures referring to distinct latency measurements should not be treated as interchangeable or simplified for the sake of perceived comparability.
For example, ‘order round-trip latency’ measures the time between submitting an order and receiving the corresponding execution report. The same test run can produce multiple valid latency figures for this measurement, they could also vary by message rates (e.g., runs with the message rate of 100 messages per second (mps), 1,000 mps and 10,000 mps). The test runs shown in Figures 8-10 included order entry (OE), market data (MD) and Drop Copy (DC) users.
The latency figures obtained from the same test run could include:
- The ‘maximum’ latency captures the single slowest observation;
- The 95th (see Figure 8), 99th and 99.9th percentiles show how latency behaves in specific portions of transactions. For example, the 99th percentile represents the latency at or below which 99% of measured transactions were completed, while the remaining 1% experienced higher latency;
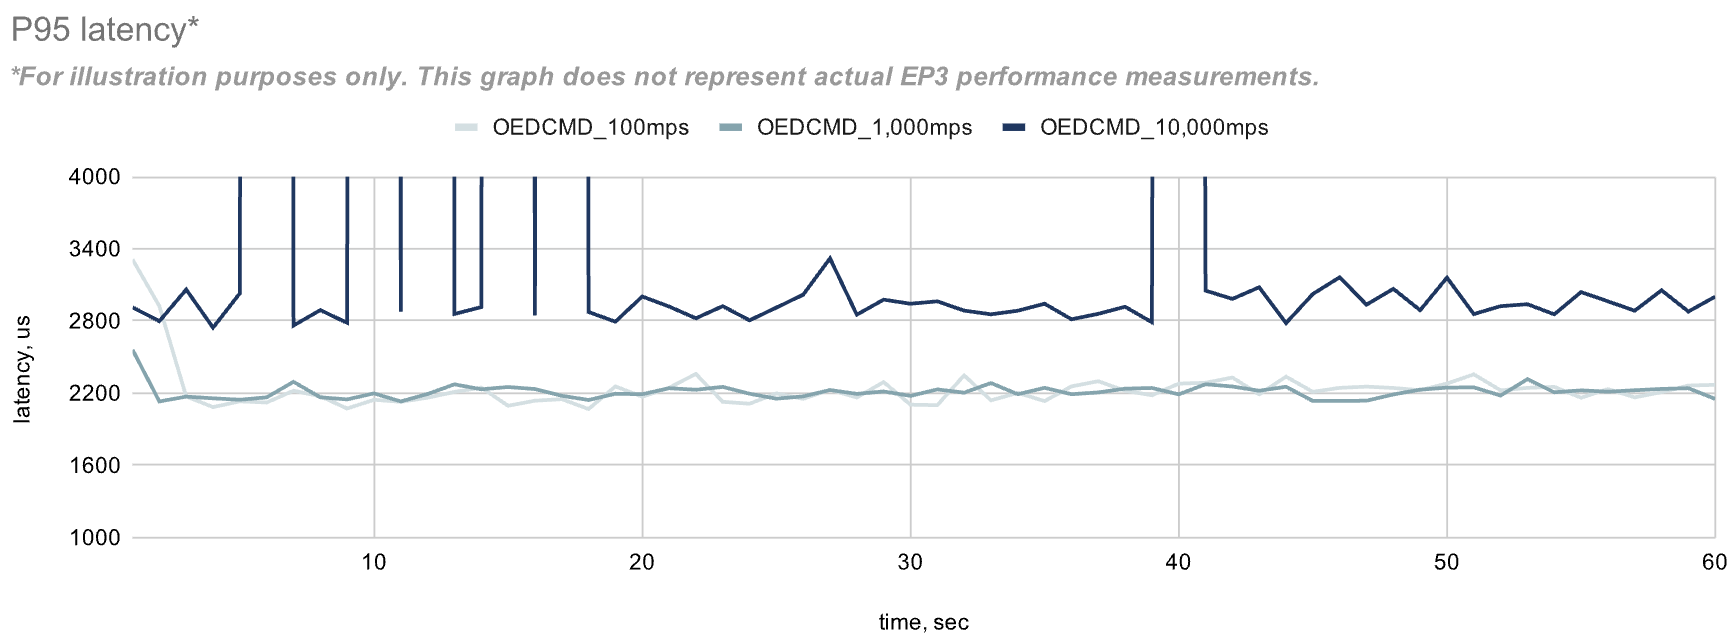
Figure 8. P95 latency
- The ‘median’ latency measurement (see example in Figure 9) describes the middle of the distribution: half of the transactions were faster and the other half slower;
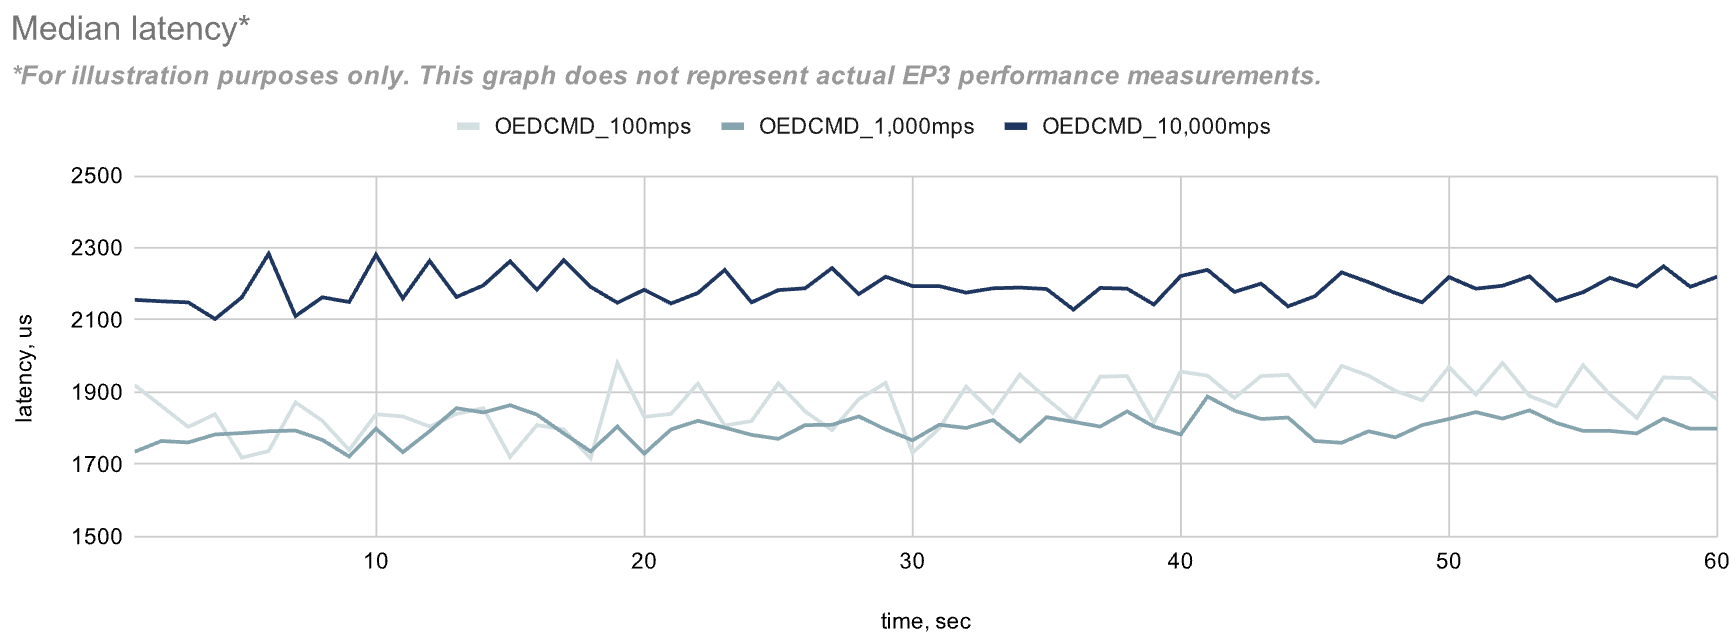
Figure 9. Median latency
- The ‘average’ latency (Figure 10) number provides a summary of the distribution but can be strongly influenced by outliers (so it tends to be less accurate as a metric, compared to the percentile or the median numbers).
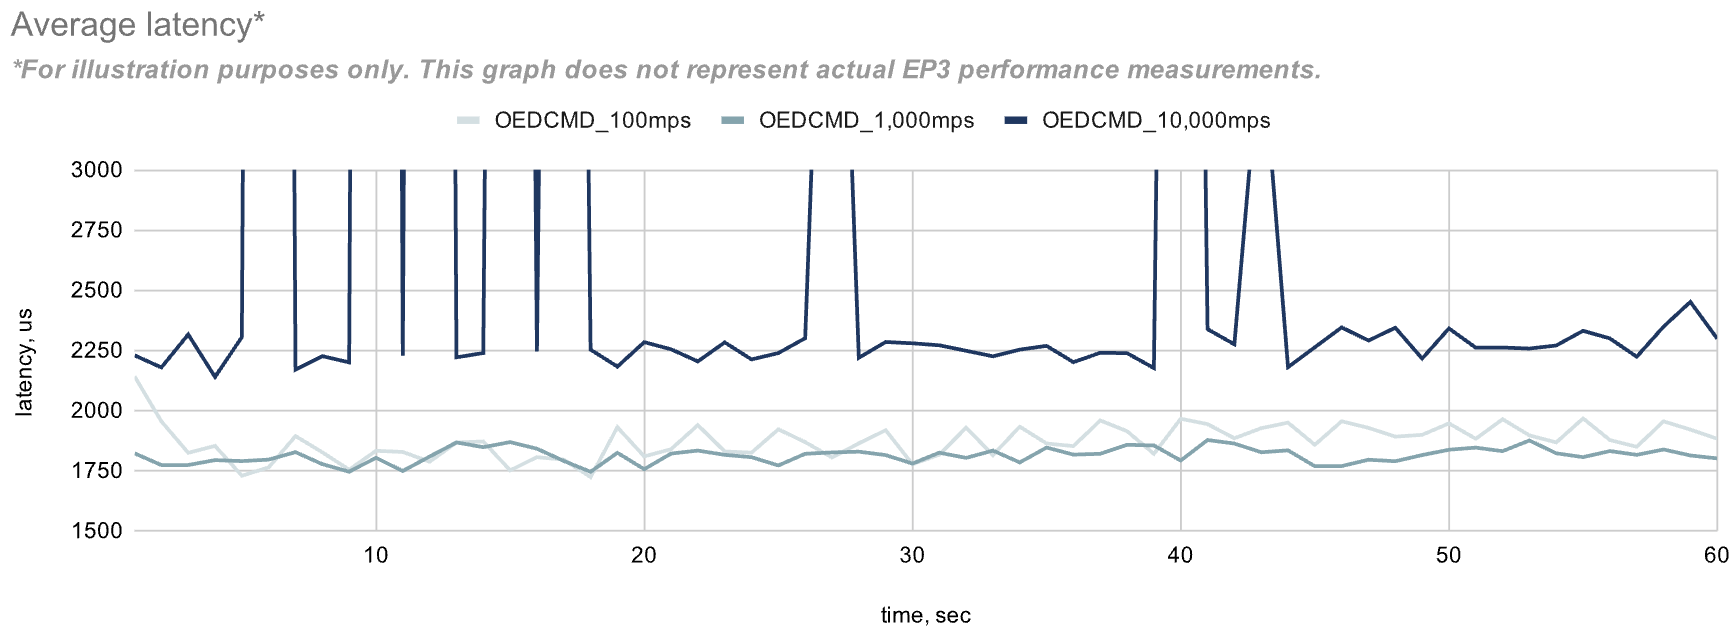
Figure 10. Average latency
As a result, a statement such as ‘the system's latency is 500 microseconds’ would be incomplete unless it specified what was measured, where the measurement was taken and how the observations were summarised. For example:
- ‘median order round-trip latency was 500 microseconds’ conveys something materially different from ‘99th-percentile order round-trip latency was 500 microseconds’; or
- ‘average latency of 70 microseconds at a load of 50,000 operations per second for 90% of processed orders’ still doesn’t say anything about the load composition or specify what ‘operations’ are.
The same principle applies when comparing different latency types. Order round-trip latency, in-system latency, order-to-market-data latency and execution-report-to-market-data latency measure different segments of the transaction flow and should be reported separately rather than combined into a single headline latency figure.
Clear definitions are therefore essential when presenting benchmark results. Each reported latency figure (as seen in the Figure 11 sample) should trace back to the measurement type, measurement points and the statistical representation used. This ensures that the numbers accurately describe system behaviour and can be interpreted or compared without creating a misleading impression of performance.
| 100_max | 99.9_max | 99.0_max | 95.0_max | median | min | average | |
|---|---|---|---|---|---|---|---|
| 100mps | 2,600 | 2,400 | 2,300 | 2,200 | 1,800 | 1,300 | 1,850 |
| 1,000mps | 4,900 | 3,150 | 2,440 | 2,220 | 1,800 | 1,100 | 1,790 |
| 10,000mps | 45,400 | 40,000 | 27,600 | 16,300 | 2,200 | 1,200 | 3,850 |
Figure 11. Sample system latency benchmarks per message rate, us*
*For illustration purposes only. This data does not represent actual EP3 performance measurements.
Latency measurement methodology used for EP3
The latency calculations for EP3 included the following steps:
- Execution of the latency run with a specified message rate and distribution of message and order types;
- Reconciliation of timestamps by unique keys (e.g. ClientOrderID and others) between the messages sent and the responses received;
- For each message, recording a) its RequestTime, b) its ResponseTime, c) the difference between them (individual latency of that message), and d) other data valuable for deep system analysis;
- Aggregating the data per second, calculating the p99/p95/Min/Max/Avg/Median latencies;
- Aggregating the data per test run, obtaining various metrics, including the p99/p95/Min/Max/Avg/Median latencies.
Calculating and reporting system throughput metrics
Similarly to latency metrics, throughput figures need to be clearly defined to be meaningful. A statement like ‘the platform processes 1 million orders per second without degradation of other performance or functional parameters’ does not, by itself, describe the system's performance sufficiently. The reported figure depends on what is being counted, how the workload is structured, where throughput is measured and whether the result represents a short-lived peak or a sustained rate.
Depending on the measurement point, throughput may refer to ‘orders submitted to the system’, ‘orders accepted by a gateway’, ‘orders processed by the matching engine’, ‘completed transactions’ or ‘messages exchanged between system components’. These figures are not interchangeable and can represent different amounts of work performed by the platform.
Workload composition also has a direct impact on throughput. New orders, amendments, cancellations and trades can place different demands on the system. A benchmark based predominantly on one message type may produce a very different result from a workload that reflects the mix and sequence of messages encountered in a live trading environment.
It is also important to distinguish between peak and sustained throughput. A system may be capable of processing a very high volume for a short period of time (peak throughput) without being able to maintain the same rate over an extended test (sustained throughput). Peak throughput indicates the system's short-term headroom and burst-handling capability – relevant for scenarios involving traffic spikes, failover events or peak demand periods. It also has value as an indicator of the platform's performance potential and may be used in competitive positioning – provided that the conditions under which it was achieved are clearly described.
Throughput should therefore be reported together with the conditions under which it was measured, including the workload profile, message mix, duration, measurement point and relevant system configuration. Where appropriate, the results should also be correlated with latency and functional reconciliation to establish whether the measured throughput was achieved while the system continued to meet expected performance and functional requirements.
This approach prevents a single throughput figure from being presented as an absolute characteristic of the platform. Instead, it provides a more accurate representation of how the system behaves under a defined workload and operating conditions.
System throughput: measurement process breakdown
Two numbers describe a message-processing system under load, and they depend on each other. Maximum throughput is the highest steady rate the system can handle without falling behind. Latency is how long a single message waits before it is processed. We report latency at the 99th percentile, which is the slowest message count, not just the average one. A latency number is meaningless unless the load it was measured at is known. Every system is fast when idle, what matters is the load at which latency starts to grow, and what happens after that.
Figure 12 shows a 25-second test run. The maximum throughput of the system used to illustrate this experiment was measured at 50,000 mps. Let’s follow and interpret the graph:
Seconds 0-4: Normal load
The load is about 10,000 mps. Every message is processed in the same second it arrives, nothing builds up and the p99 latency stays at 1.5 ms.
Second 5: The knee
The load rises to 48,289 mps, or 96% of maximum throughput. It is still under the limit and nothing is buffered yet, but the p99 latency is already 35 ms – twenty times higher than before. Latency starts to grow before the limit is reached. This is why it is recommended that headroom be planned around this point, and not around the maximum.
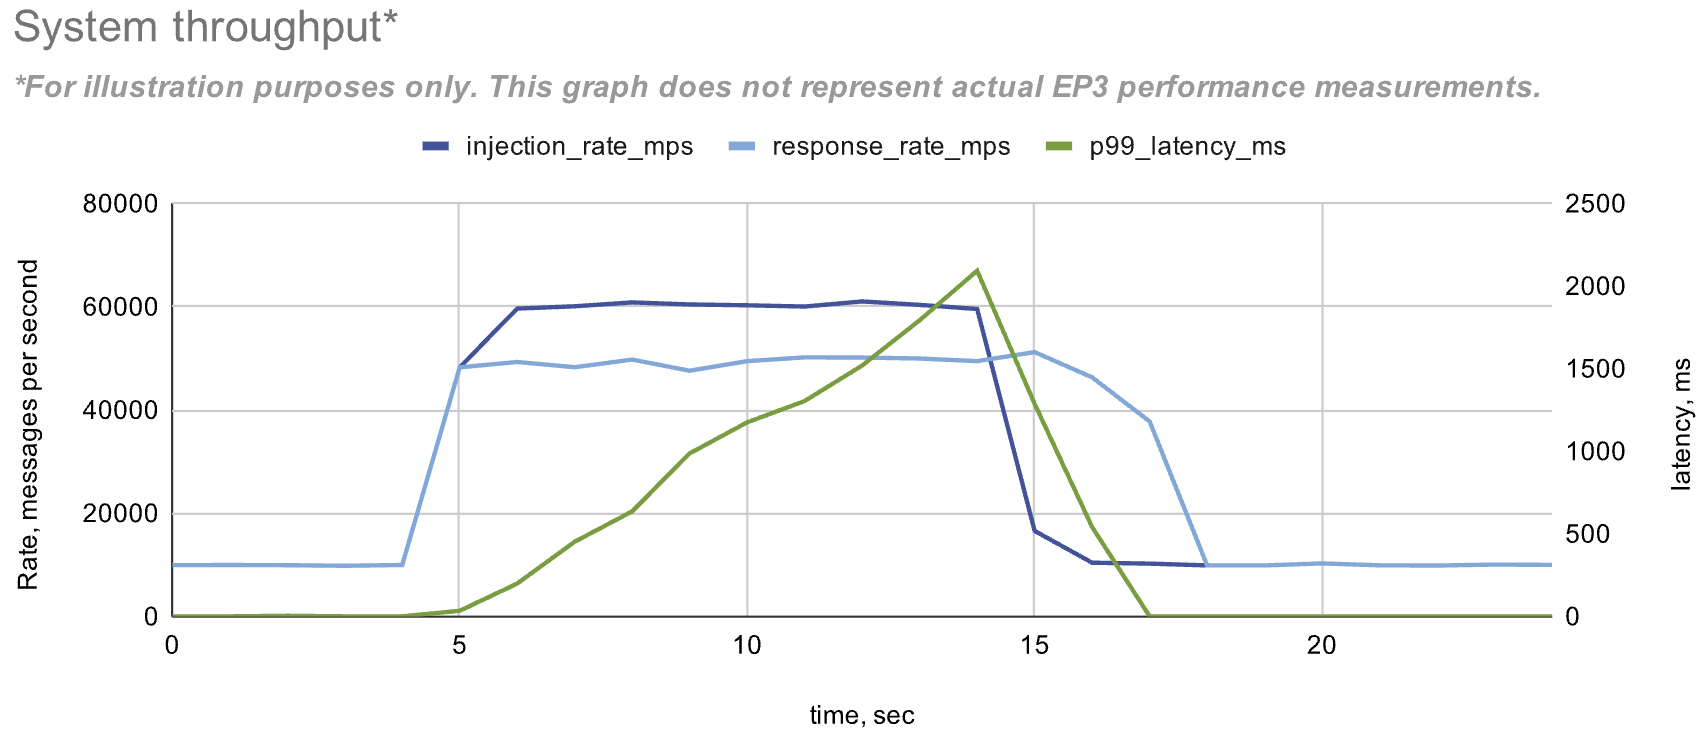
Figure 12. System throughput
Seconds 6-14: Overload
The load rises to about 60,000 mps, but the output rate does not follow it. Instead of tracking the input as it did below the limit, it separates and settles at 48,000–50,000 mps, remaining there for the whole overload period. This is how the limit is read off the data: below it, the output simply mirrors the input, because the rate is set by how much is offered; above it, the output stops responding, and the 10,000 mps of additional load produce no additional output. The rate the system settles at is therefore its maximum – about 50,000 mps – and the 48,000–50,000 spread is second-to-second measurement noise, not a downward trend.
The surplus 10,000 messages per second go into a buffer, which grows to 98,095 messages; that growth rate equals the gap between the two rates exactly, confirming the same figure. Latency follows the buffer directly: each message waits for all the messages ahead of it, so the delay equals the number of waiting messages divided by the rate they are processed at. The p99 latency grows in a straight line, about 200 ms for every second of overload. By second 14, it reaches 2,094 ms – 1,400 times the normal level, from a load of only 20% above the limit. The key is that point above the maximum throughput, latency is not a fixed number. It depends on how long the overload lasts. Ten seconds of overload cause twice the latency of five seconds at the same rate.
Seconds 15-17: Recovery
The load drops back to 10,000 mps, but the buffer does not clear instantly, and this is where the recovery rate is read off the data. The output rate stays pinned near 50,000 mps, even though only 10,000 mps are now arriving – the gap between the two is a sign that the system is draining a backlog rather than tracking live input. It can only drain at whatever throughput the incoming load leaves free: 50,000 minus 10,000, or 40,000 mps of spare capacity. At that rate, the 98,095 buffered messages take about 2.5 seconds to clear, and latency falls in a straight line as the queue shortens, mirroring the way it rose. The buffer is empty by second 17, the output rate drops back to meet the input, and the p99 latency returns to 1.6 ms.
Ten seconds of overload cost 2.5 seconds of recovery, and neither figure is arbitrary: both are fixed by the same arithmetic. Peak latency and recovery time each grow in proportion to how long the overload lasts and to how far it goes above the limit – double either, and both double. Nothing in the system stops this on its own. As long as the buffer has room, every message offered is accepted and queued, so a short burst of excess load produces a delay that outlasts the burst that caused it – which is why an explicit bound on the buffer, rather than the buffer itself, is what limits the damage.
Throughput parameters obtained in the experiment illustrated:
- maximum throughput – 50,000 mps;
- normal load – 10,000 mps;
- burst – 60,000 mps (sustained for ten seconds, measurements sampled once per second, with noise added to reflect real instrumentation).
All values above the limit follow arithmetically from these parameters, so the figures in the chart are internally consistent and can be checked against one another.
The Results
As evidenced in this case study, the same ‘orders per second’, ‘latency’ or ‘throughput’ metric used for venue benchmarking and subsequent competitive positioning can stand for largely different computational workloads. Whenever these metrics are reported, a larger context of the assessment exercises conducted should be provided, including the hardware and software configuration under test, the load composition, the measurement point and methodology used.
In addition, high throughput has little value if the platform is not behaving correctly under load. Even though the primary objective of load testing is to characterise non-functional behaviour, it simultaneously exercises multiple functional areas. This makes functional reconciliation both essential and challenging. Alongside measuring performance, it is necessary to verify if the system continues to behave correctly under load by reconciling inputs with outputs and confirming that responses across all relevant interfaces remain functionally accurate and consistent.
The testing programme deployed by Exactpro verified EP3's ability to sustain demanding trading workloads commensurate to its current workload and trading volumes currently assessed as relevant, while maintaining predictable performance and functional correctness. Across a series of increasingly intensive, production-like test scenarios, the platform was benchmarked in terms of throughput, latency and resilience under sustained and peak loads.
The resulting benchmarks obtained provided a transparent view of EP3's performance characteristics under defined operating conditions, giving meaningful evidence of the platform's scalability, performance and operational resilience.
The information from the production-like testing was used to introduce iterative improvements of the system's functionality and operational resilience throughout the testing engagement and after it. The insights have also contributed to:
- shaping an objective image of the platform’s functional and non-functional parameters;
- establishing clear baseline benchmarks for future EP3 evolution;
- better visibility into the platform’s behaviour under stress, critical for operation under heavy volumes or during unexpected, disruptive events;
- support of onboarding future exchanges and trading venues by Connamara Technologies.
Strategic Impact for Exchange Operators
Specialised third-party testing using high-performance frameworks able to test at the intersection of functional and non-functional testing requirements can help new and established trading venues to lower product risks and improve platform stability and long-term operational resilience. The findings obtained as a result of independent testing activities can also be used to:
- facilitate test strategy development and regulatory filings,
- inform release decisions, support customer evaluation, policies and regulatory compliance activities based on objective evidence of the true state of technology;
- strengthen operational continuity measures, recovery preparedness and system capacity management;
- improve readiness for new asset classes and business models;
- support continuous platform innovation;
- demonstrate that reasonable, technologically sound measures have been taken to provide high levels of the system’s integrity and compliance.
Key Takeaways
- The case study is a collaboration between Connamara Technologies and Exactpro, it details the testing approach used for the EP3 platform developed by Connamara Technologies, with a focus on non-functional testing and benchmarking methodology applied by Exactpro.
- Collaboration between platform providers and specialist software testing firms can help produce an objective picture of the true state of a fintech system.
- Independent testing expertise that has reusable automated test assets and a scalable, industry-proven test approach can help strengthen the trading venue’s operational resilience, improve long-term delivery efficiency and accelerate platform maturity for future development and use cases.
- The success of non-functional testing activities is highly dependent on developing versatile and production-like load composition and load shapes.
- Performance measurements reported by trading venues may vary. The differentiation between ‘orders per second’ and ‘messages per second’ is important. Latency measurements depend on the point of measurement and can imply: ‘order round-trip’, ‘in-system’, ‘order-to-market-data’ or ‘execution-report-to-market-data’ – all these measure different parameters, and a single blended figure across a whole message mix obscures the differences between new order, amend, cancel and trade confirmation paths.
- It is also important to distinguish between peak and sustained throughput. The exact performance measurements taken should be clearly described throughout the process in terms of the reference data basis used; the resulting report should clearly reflect the nature of measurements presented.
- Beyond measuring performance, it is important to continuously verify if the system behaves correctly under load by reconciling inputs with outputs and confirming that responses across all relevant interfaces remain functionally accurate and consistent. Testing at the intersection of functional and non-functional requirements remains crucial for complex transaction processing systems.
Case Study by Connamara Technologies and Exactpro