Date:
1. Defect Analysis — Key to Successful Software Product Management
Defect management is an essential part of improving the technical stability of software. It is really important because software defects cost billions of dollars in damage control [1]. That’s why software needs to be tested. On top of that, analysing defects helps determine the dependencies that are difficult to reveal by human processing capabilities alone. Defect analysis allows to provide effective quality assurance processes, but analysis is usually accompanied by several obstacles. First of all, a project can have thousands of defects, and that is hard to process them manually. Secondly, we need to not only evaluate the statistical data, but the links between different defect attributes. Machine learning can solve both problems in the best possible way.
2. Nostradamus Tool To Resolve Tasks with Various Groups of Specialists
This white paper aims to present the Nostradamus tool — a tool based on machine learning methodologies and the cumulative research of the Exactpro Research and Development Department [2,3].
Nostradamus analyses defect reports and determines important dependencies between defect attributes. Nostradamus allows to resolve tasks for different groups of specialists. QA engineers can increase the quality of defect reports using this tool. Managers can analyse the project status. System architects and developers can discover the hidden dependencies in development. Each option will now be considered separately.
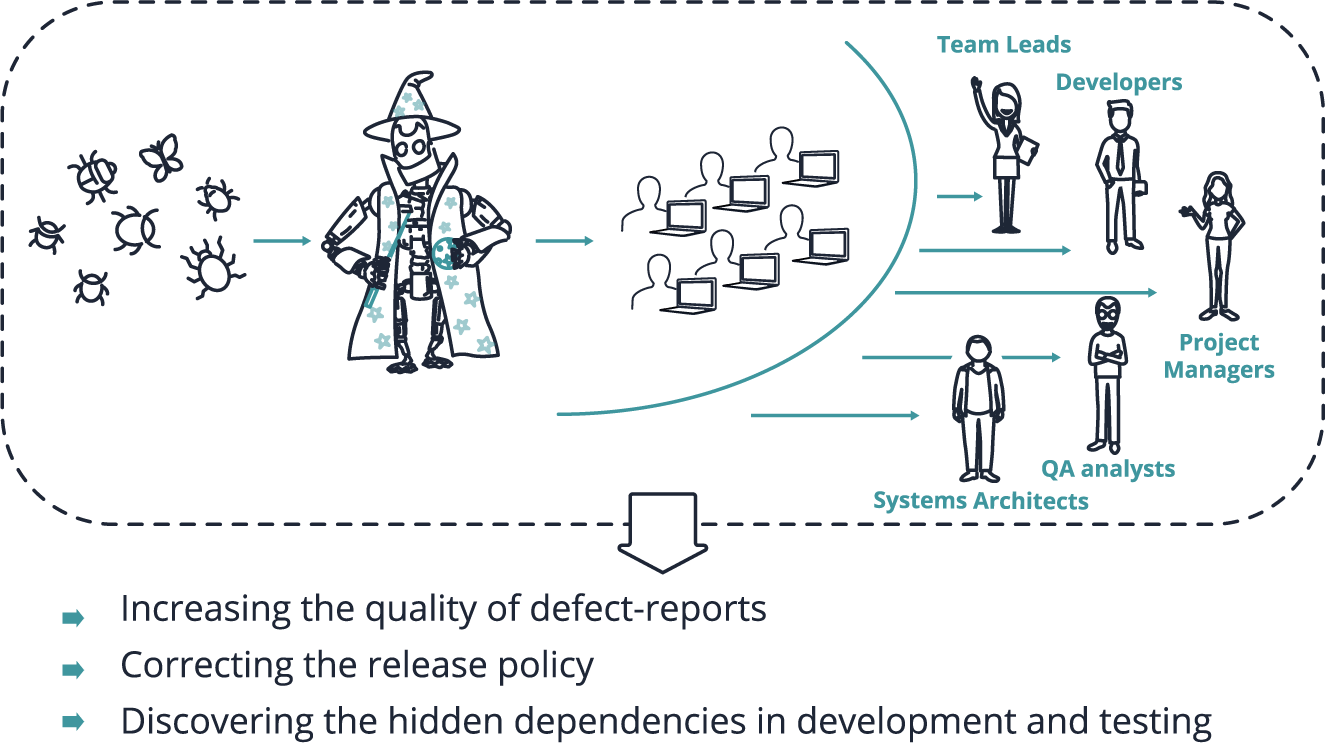
Nostradamus can improve the quality of defect reports by generating recommendations for the QA engineer. It’s especially important for junior specialists. They can use Nostradamus recommendations to make their defect reports better and more understandable. It’s possible because the machine learning algorithm is sensitive to the text that the submitter is writing. The essence of these recommendations is to provide the following probabilities:
- the probability of a bug belonging to a specific area of testing,
- the probability of a bug being rejected,
- priority levels,
- the probability of a bug being fixed, including time to resolve
Nostradamus allows to correct the release policy because it’s able to predict the testing metrics. A Project Manager can change the release decision when he or she knows that a bug could be fixed within a certain time period. Knowing that, they can either include this software feature into the next version of the software or exclude it from the next version.
Architects and Developers can tackle software weaknesses and improve the development strategy via defect clustering. Clustering is a method that compresses data by grouping a set of defects into clusters in such a way that similar defects end up in the same cluster and dissimilar defects end up in different clusters. Interpreting clusters allows to determine the average representative of each cluster and its characteristics. It gives a chance to understand the nature of defects, because the number of defects that affect the decision-making process is reduced from thousands to just several bug representatives.
3. Applying Machine Learning and Text Mining to Defect Analysis
Nostradamus uses machine learning. For humans, the dependencies between input and output are a ‘black box’. In our case, input is a defect description, and output is a defect priority, the area of testing that the defect belongs to, and so on. A highly experienced QA Engineer can only assume how they connect, but even that is just intuition that is hard to formalize. In contrast, machine learning can reproduce these dependencies. Moreover, it can calculate the output for new data because the algorithm is capable of learning. Unlike human intuition, this capability is quantifiable. To provide a high-quality learning result, we have used over five thousand defect reports from various projects submitted in the past three years.
The description of a bug report is one of the crucial things for defect analysis, and it’s in text format. So, Nostradamus transforms text via natural language processing methodologies and analyses how the user writes the description. That allows it to evaluate the significance weight of every word and determine the top of the most significant words for every predictable output.
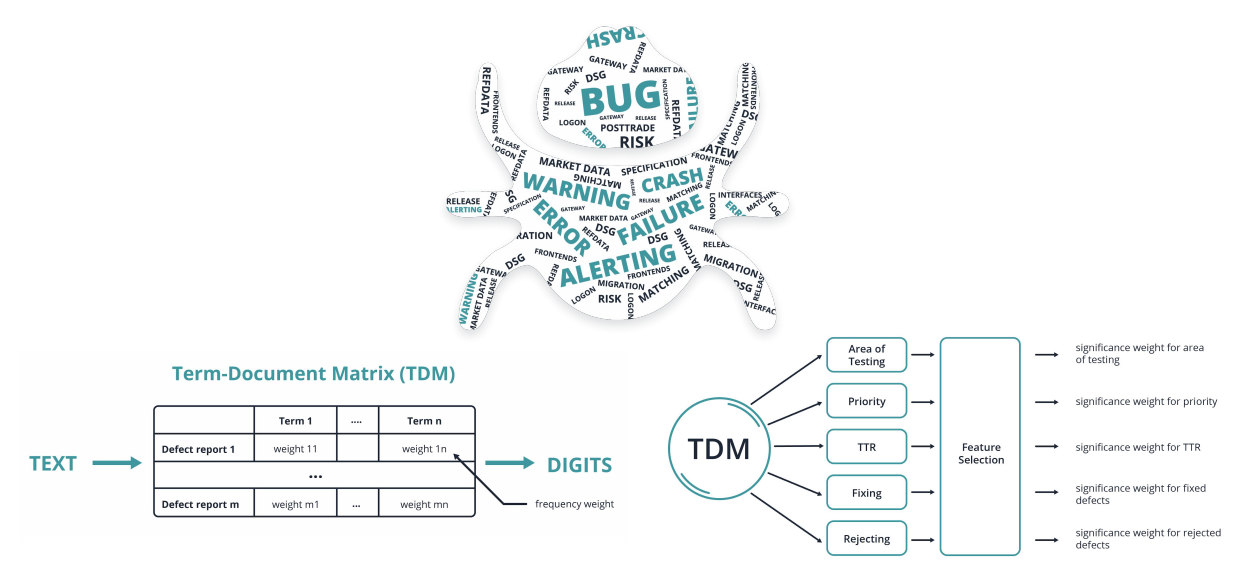
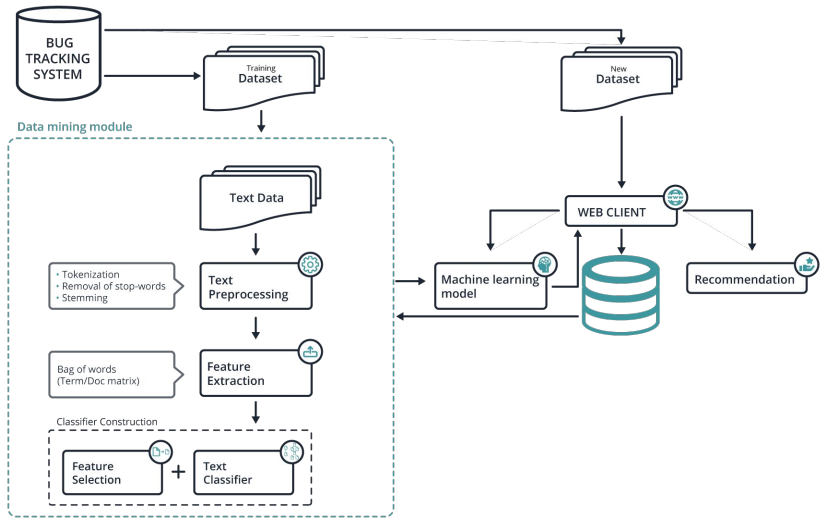
Nostradamus learns from defect reports that are submitted into the bug-tracking system. The learning process is presented in the Data Mining Module part of Picture 3. It includes text preprocessing, feature extraction, feature selection and classifiers building [4]. Machine learning models are obtained from this model. And when we get a new defect report that was not in the training dataset, we use these built models. Then Nostradamus creates recommendations that are based on the calculated models. Finally, the recommendations and the users estimation are recorded into the database. We record the users estimation in order to improve the classification models.
4. Nostradamus Architecture
Nostradamus is written in Python and uses its libraries. Python has been widely adopted by the scientific community. Python is a productive, readable programming language with strong mathematical potential, and its libraries include powerful statistical and numerical packages. Python’s ecosystem keeps growing year after year, and it becomes more and more capable of statistical analysis.
5. Examples
The Nostradamus possibilities in the form of defect report examples will be demonstrated further in this paper, but a couple of clarifications are needed before that. First of all, these examples are quite close to real defect reports, but they are not real: they are not defect reports which were used for training, or which are submitted into the bug-tracking system at this time. They describe hypothetical situations in a language typical for submitting bugs. Secondly, the considered examples are short because they are simpler for the reader’s understanding. Thirdly, it is important to mention that Nostradamus was trained on defect reports of certain projects. So it is only ready to perceive a certain kind of text. Now let's move on to the examples.
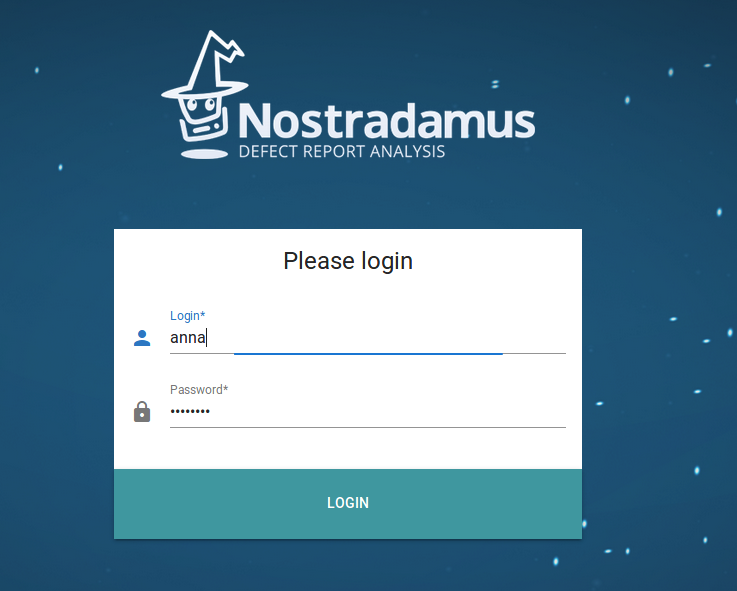
At the beginning, we need to login to Nostradamus.
After that, a form for submitting the defect description is displayed.

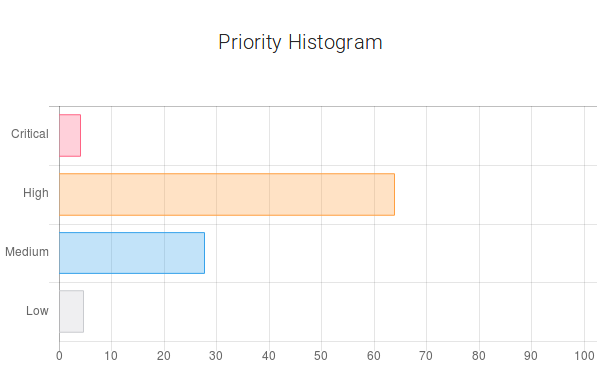
Let’s imagine that there is a problem with memory consumption that resulted in a crash of ITCH gateways. The submitter enters the following text: "Extremely high memory consumption was observed in Prod system with release 1.2.3.4.5.6 installed during ITR and ITCH gateways crashed." The submitter clicks the submit button and get the following results.
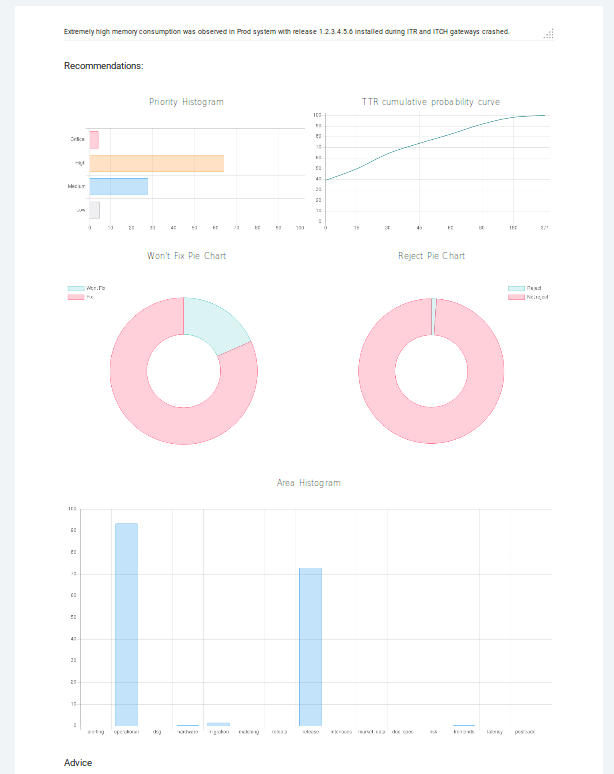
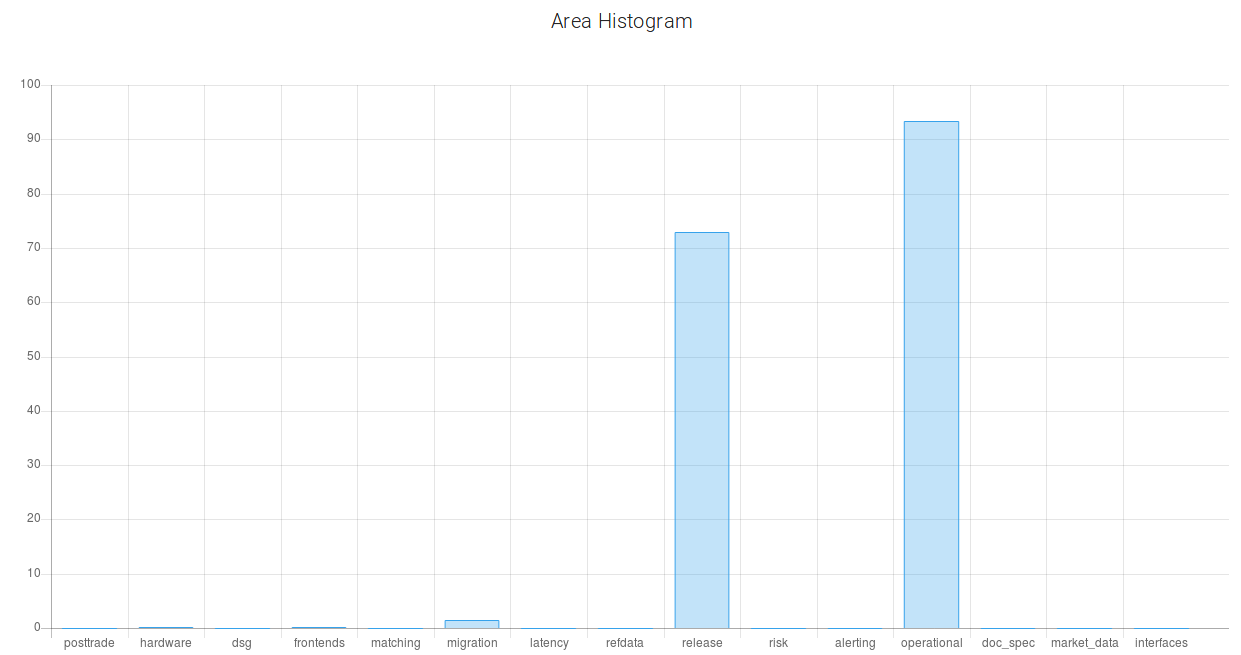
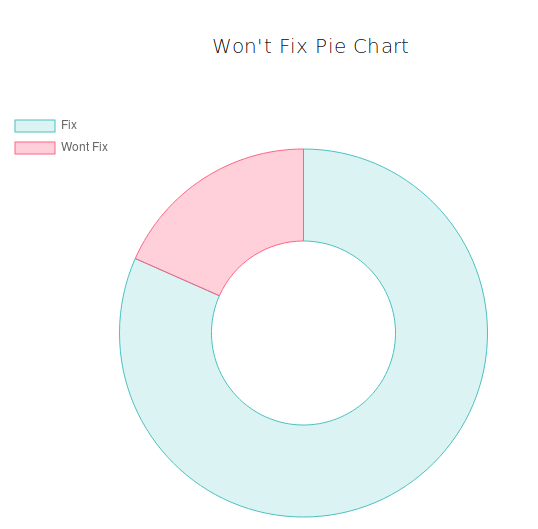
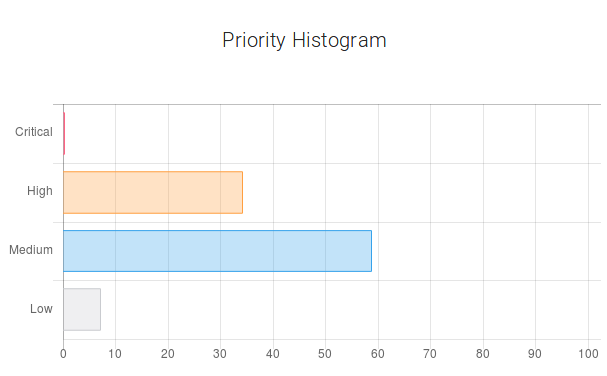
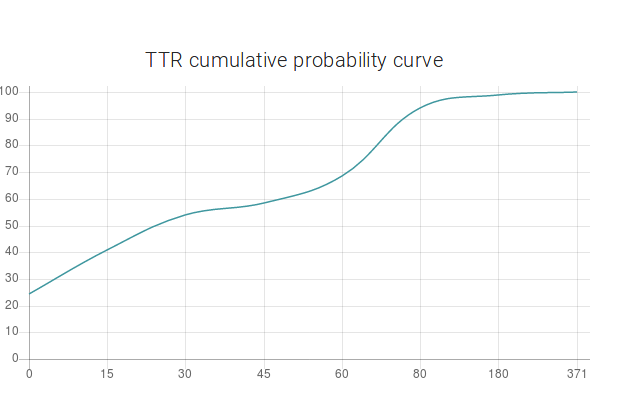
The horizontal bar chart gives information about the probability of each priority. We see that high priority has the highest probability (around 64%). The next probable priority is ‘medium’ (around 27.6%). And it is unlikely that this defect will be critical. The curve describes the cumulative probability of a certain time period in days. The next two pie charts represent the probabilities of fixing and rejecting a bug report. And for this example, the probability of a situation when the submitted bug report will have a "won't fix" resolution is 18%. The last bar characterizes the fact of belonging to a specific area of testing. The area of testing is represented by parts of the software and/or hardware combined. This compound is based on the technological and business points of view. QA leads or Managers create test strategies and test plans, dividing the whole scope of work into several areas of testing connected with each other. As a rule, they do not assign distinct components, like separate buttons or functions, to QA engineers, as development team leads usually do. Instead, QA leads assign the areas of testing or their intersections. For instance, the area of interfaces that includes different gateways, or the area of deployment that includes various scripts, databases, etc. In creating a testing strategy, the starting point is not separate scripts or gateways, it’s rather terms belonging to a higher level of abstraction. According to this bar chart, this defect belongs to the Operational area with the probability of 93.4% and to the Release area with 72.9% probability. The user can also enter the labels and the priority which correspond to the defect description in his/her opinion. This data will be stored in the database. This feature is used to improve the learning capability of Nostradamus. Now, let’s change the description.
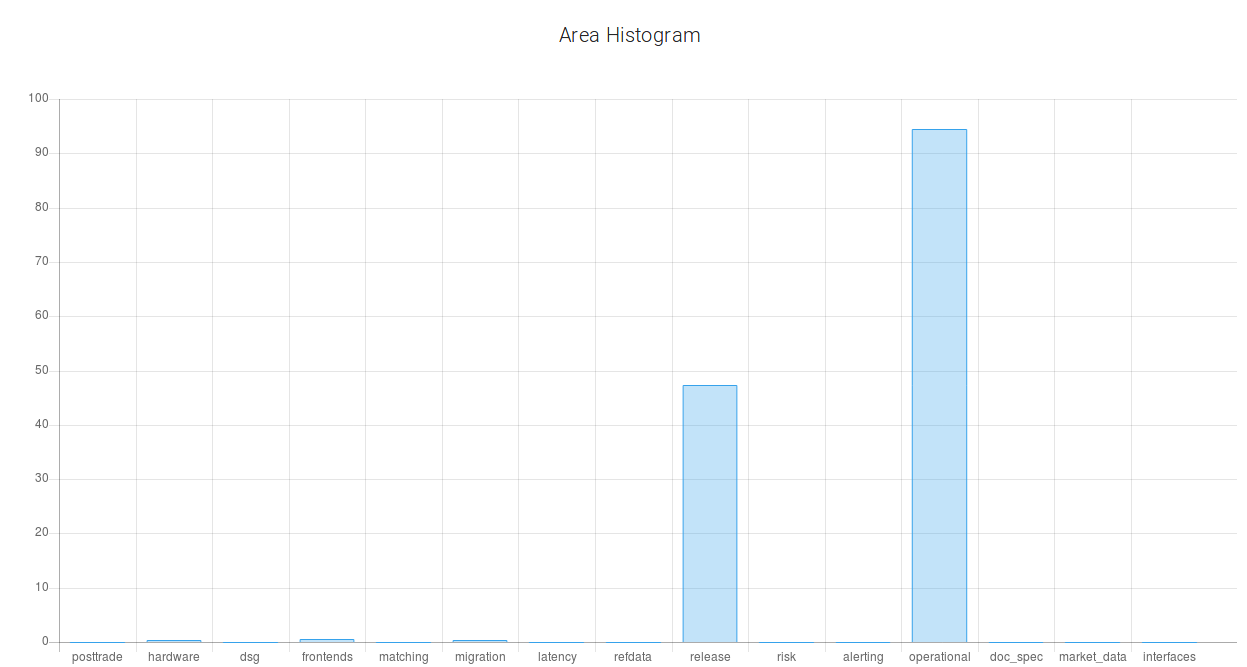
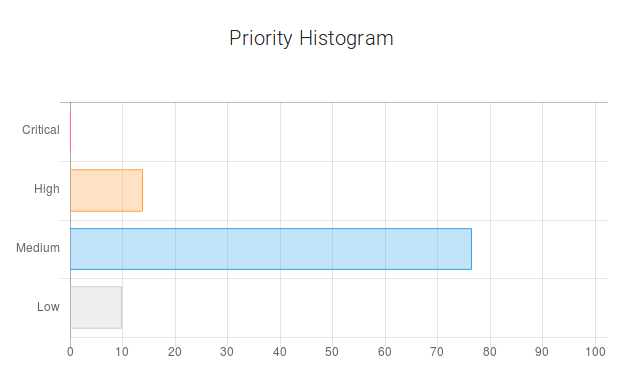
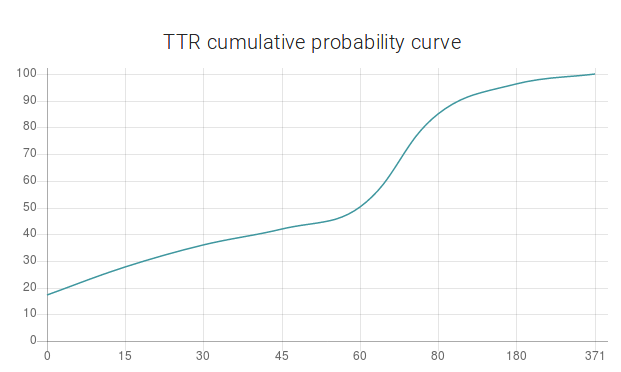
The submitter will change the phrase about the crash and add the phrase about the attachment files. "Extremely high memory consumption was observed in Prod system with release 1.2.3.4.5.6 installed during ITR. All ITCH gateways consumed up to *** GB of RAM. They crashed, except for three pairs of ITCH gateways. Probably this issue can be related to issue #1234567. Backend logs, data files, corefiles, DB dumps are attached." After submitting, it is now likely that the defect report is critical. The probability of a ‘сritical’ priority became higher. It happened because the user slightly clarified the crash situation and added the information about the logs, dumps and other files that confirm the submitted problem.

Secondly, the probability of the issue belonging to the release area became lower. Because, according to the new description, the focus shifts from it being a release problem to more of a system problem.
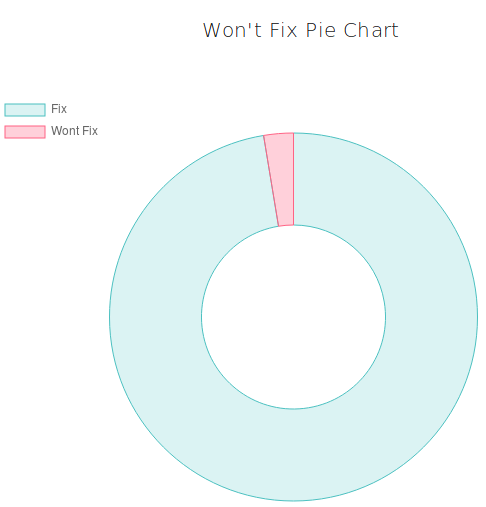
And, thirdly, notice that the probability of a "Won't Fix" resolution has decreased significantly. It happened because the user added the information about the logs, dumps and other files that confirm the submitted problem.
From these examples, it is obvious that a couple of sentences can not only change the probabilities digits, but also the text perception.
So, the first example was about adding text. Now, let's consider an example where the user slightly changes the wording. In the new example, we have a problem with inconsistencies between a database column and a corresponding field in the FrontEnds. And we are politely asking the assignee to confirm and clarify these database changes. So the user writes the following text: "The FIRM_ID column has been added to table in database in release 1.2.3.4.5. This column has value 'null' for all venues. In FrontEnds this field is displayed as not active for filling 'Participant ID'. Could you please confirm that this is expected change for database and clarify usage of this field ?" After submitting, the user gets the following results: It's 58% likely that this defect has ‘medium’ priority. The probability of a "Won't Fix" resolution is 17% and the probability of rejection is 7%. According to the bar chart, this defect belongs to the Migration area with the probability of 95%.
Now, let’s slightly change the wording. The submitter will ask not to confirm the database changes, but to update the specification. So they write "The FIRM_ID column has been added to table in database in release 1.2.3.4.5. This column has value 'null' for all venues. In FrontEnds this field is displayed as not active for filling 'Participant ID'. But there is no description of this field in Volume 1 and 2. Could you please update specification regarding this field ? ". The metrics have updated after that: the probability of a ‘medium’ priority has increased from 58% to 76%.
The tool recalculates the probabilities of time to resolve according to the changes in the description
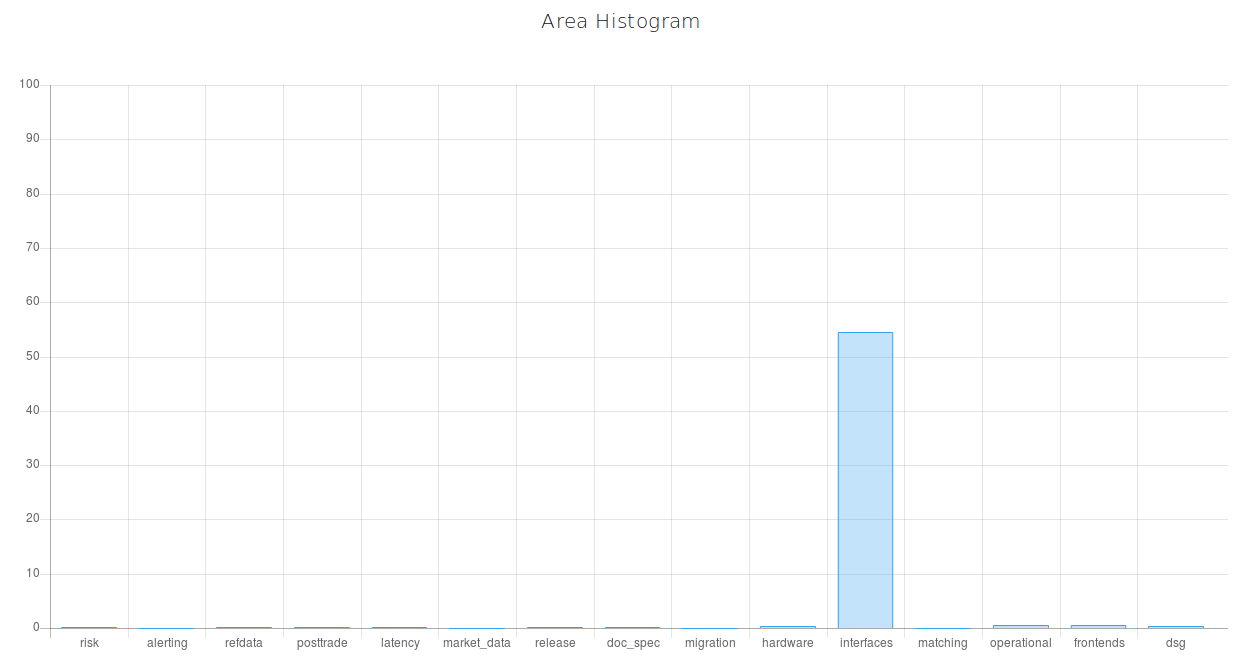
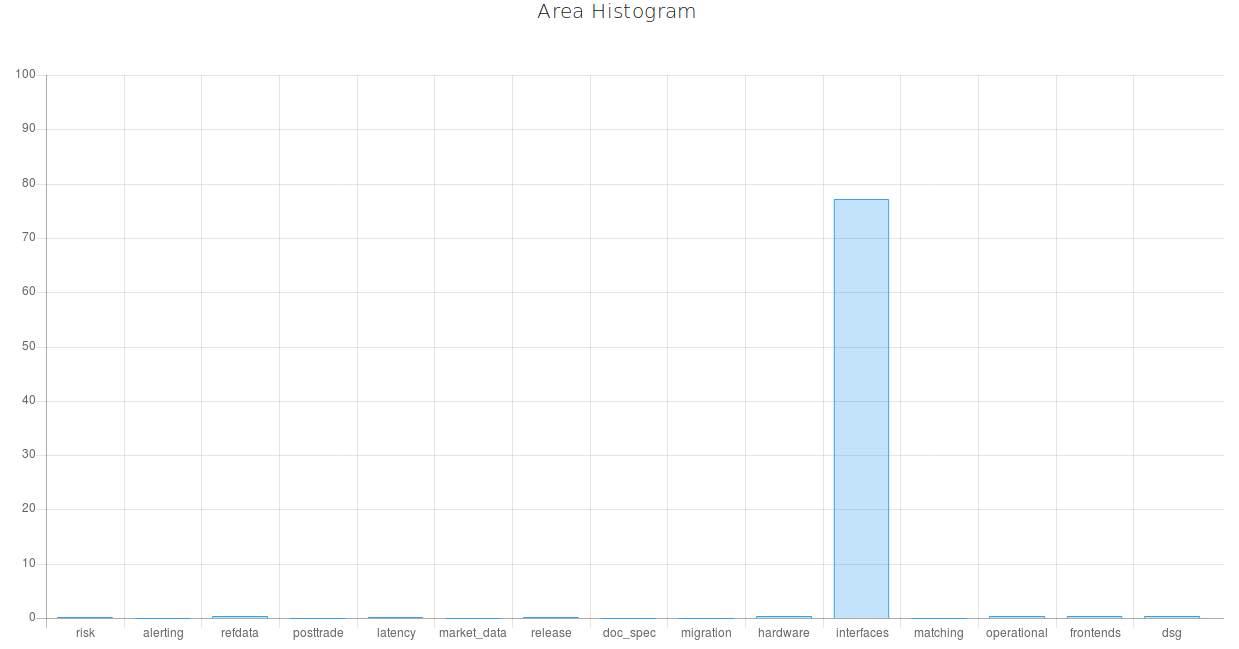
The last example is very interesting too. It is devoted to a Fix Gateway Message problem. The user enters the following text: "According to FIX Trading Gateway specification, "DeliverToCompID" is a header tag but we can see that in Execution Reports this tag is placed in the body of the message and not in its header. The issue can be observed in 1.2.2 and not reproducible in 1.2.1." Nostradamus gives the following data. This defect can be of ‘high’ or ‘medium’ priority because their probabilities are almost similar, and it belongs to the interfaces area with the probability of 55%. And then, the user just adds a couple of words about the attached logs and pcap files. “According to FIX Trading Gateway specification "DeliverToCompID" is a header tag but we can see that in Execution Reports this tag is placed in the body of the message and not in its header. The issue can be observed in 1.2.2 and not reproducible in 1.2.1. Please refer to the attached logs and pcap files.” After this addition, the issue becomes 22% more likely to belong to the interfaces area because this information is significant when it comes to the gateway area.
6. Conclusion
To conclude, Nostradamus takes into account the following things: firstly, Nostradamus is sensitive to the submitted text. The tool recalculates the probabilities of metrics according to the changes in the description. As a result, the submitter is able to improve the defect report based on the tool recommendations. It gives a chance to avoid situations when the description is not transparent to developers or analysts. Secondly, Nostradamus determines the words with high significance weight, like in the description of example 3. Thirdly, team leads and managers can use Nostradamus recommendations on time to resolve, in order to correct the testing strategy or the release policy.
In the near future, Nostradamus is expected to give a wide range of IT-specialists a possibility to improve their software products. The focus of Exactpro R&D Department’s future work is analysing not only snapshot data, but also data in the context of dynamic changes. It will allow to discover more complex dependencies via Nostradamus. Another direction of the Department’s work will be aimed at improving the performance of the prediction models and investigating the nature of defects via cluster analysis.
References
- Research Triangle Institute, The Economic Impacts of Inadequate Infrastructure for Software Testing, NIST Planning Report 02-3, May 2002.
- Gromova A. (2018) Defect Report Classification in Accordance with Areas of Testing. In: Itsykson V., Scedrov A., Zakharov V. (eds) Tools and Methods of Program Analysis. TMPA 2017. Communications in Computer and Information Science, vol 779, pp. 38-50. Springer, Cham
- Gromova A.: Using Cluster Analysis for Characteristics Detection in Software Defect Reports / W.M.P. van der Aalst et al. (Eds): AIST 2017, LNCS 10716, pp. 152-163, 2018
- Manning C.D., Raghavan P., Schutze H.: Introduction to Information retrieval. New York: Cambridge University Press (2008)