Date:
5-min read

I have been blessed to spend the last few years working alongside very intelligent people, highly proficient in load testing for complex, distributed, low-latency systems. Over time, I almost forgot that there are many who are looking at performance test reports for the very first time in their life.
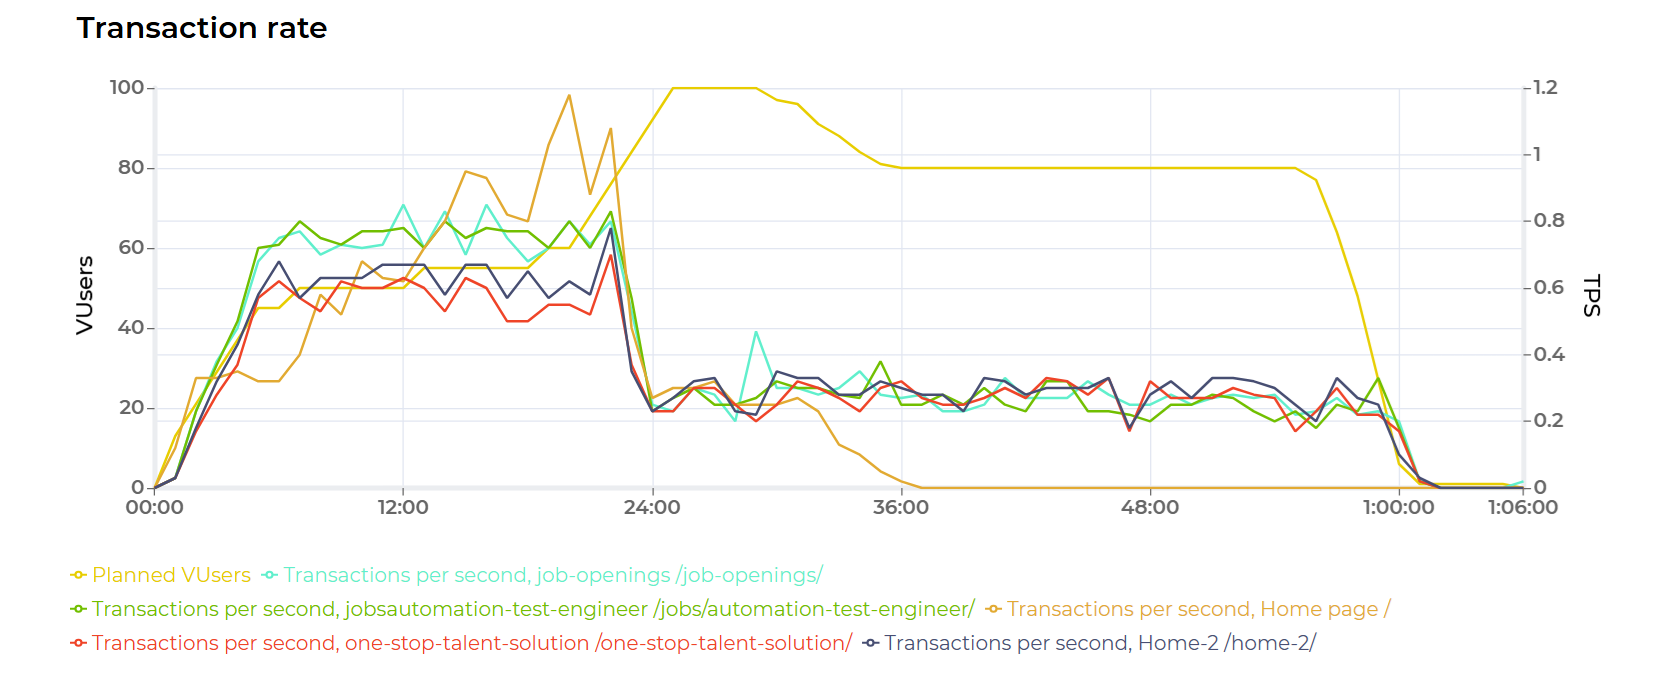
That’s why I am strangely grateful for the breath of fresh air delivered by an AI-generated report from the PFLB platform (see one of the visualisations below).
Its interpretation of load testing data is nearly indistinguishable from what a junior software tester might produce – a reminder that artificial intelligence can be remarkably good at simulating natural naïveté.
Yuri Konovalov and his team are on the right track building an artificial tester. The round of a thousand miles starts with a single step.
Here are some typical errors that inexperienced software testers make:
- If you observe that errors occur for a period and then abruptly stop, confirm that transactions are still taking place. The system may no longer be active.
- If the number of errors decreases or response times improve, it may be because your injectors are no longer active, and the transaction rate has dropped.
- If response times exceed 120 seconds in a web application, these are not valid responses but, most likely, timeouts.
- Do not include timeouts in average response time calculations. For example:
If you aggregate timeouts with responses, you might report:
- Release 3.4: 3,998 requests with an average response time of 1.3 seconds, plus 2 timeouts of 300 seconds each.
- Release 3.5: 3,996 requests with an average response time of 1.2 seconds, plus 4 timeouts of 300 seconds each.
Developers, however, are frustrated because the actual response times decreased by ~8% in Release 3.5.
- Release 3.4 average latency = 1.4494 seconds
- Release 3.5 average latency = 1.4988 seconds -> Latency appears to have increased by 3.41%.
-
While we’re on this topic: reporting latencies or percentages with five decimal places usually looks unprofessional.
-
Should you report that Release 3.5 had more timeouts than Release 3.4? You could, but you have no statistical evidence to support such a claim. For example, if each request has a 1/1000 probability of timing out, then out of 4,000 requests, you should expect around four timeouts. There is an 80% chance the observed number will fall between two and six, but it could also be higher or lower.
-
When you run load tests, you are conducting an experiment. Often, a single run does not provide enough data to support a claim, so repeating the test is necessary. The key skill is recognizing when this is the case. As a rule of thumb, begin with simple scenarios and load shapes before moving on to ‘real-world’ or ‘production-like’ loads that may be difficult to interpret.
-
Although the database is a common suspect, you need evidence before claiming it’s the problem. The same applies to any component, subsystem, query, or page. Think critically about whether you have enough data before calling something a bottleneck.
-
Sometimes you increase concurrency (more virtual users), but throughput (transactions per second) does not rise. This means the system under test has reached its capacity limit. Beyond this point, additional users only drive up response times and queueing, not throughput. This behavior follows directly from Little’s Law.
-
If latency begins to grow linearly or exponentially, the system can no longer sustain additional concurrency. In such cases, it rarely makes sense to plot data from both before and after this point on the same chart – the early part of the test will become unreadable.
-
Simultaneous connections and transaction rates reflect real-world behavior. Virtual users, however, are only a testing construct and do not exist in reality. Reporting metrics based on them is of limited relevance.
-
If your KPIs are tied to specific metrics, ensure your report includes the corresponding data.
-
Remember: bugs are everywhere – in the system under test, configurations, requirements, load injectors, monitoring, results-processing scripts, and tools. Never take anything for granted. Finding a bug is not enough; you must also describe it clearly.
We learn from bad mistakes. I’ve made a few. I am sharing these simple common-sense suggestions for you to avoid having sand in your face when you send performance testing reports to your stakeholders.
The following report provides a useful learning opportunity:
https://platform.pflb.us/shared/reports/50897840-7fa5-4f44-bb2c-54b0098…
This is a real-world example – it was actually sent to a client who paid for it. Can you spot the problems in the report?
Thank you
(A guide for those starting their journey in performance testing)