Date:
1. Introduction.
EXACTPRO
Exactpro is a part of LSEG's Technology Services division. It is a company operating with an open access model that focuses on functional and operational testing of data security, trading systems, risk management, market surveillance, and post-trade infrastructures. The company provides effective test automation with a wide coverage and outstanding cost efficiency, maintainability and sustainability. Over the years, Exactpro has developed a unique suite of test automation tools that enable it to truly excel in the field of testing services. Moreover, we are continually searching for different methodologies, including scientific research, to fulfill high quality standards that the industry puts forward. Our latest research areas are market surveillance and defect management.
Two Directions of Our Work
Electronic trading platforms have become an increasingly important part of the market in recent years. In the age of high-frequency and algorithmic trading, the technologies utilized by the trading platforms have to be highly complex and efficient. Clearly, electronic order routing and dissemination of trade information require extra attention. So the sequence of operations is an important financial subject that has recently attracted the researchers’ attention and that can improve the quality of the electronic trading platforms.
Validating a sequence of operations can be implemented via two modes. The first one is the detection of abusive behavior in the market via monitoring and analysis of all market events. It is performed by the surveillance systems which ensure detection and prevention of market abuse, e.g. distribution of false information, price manipulations, insider trading, etc.
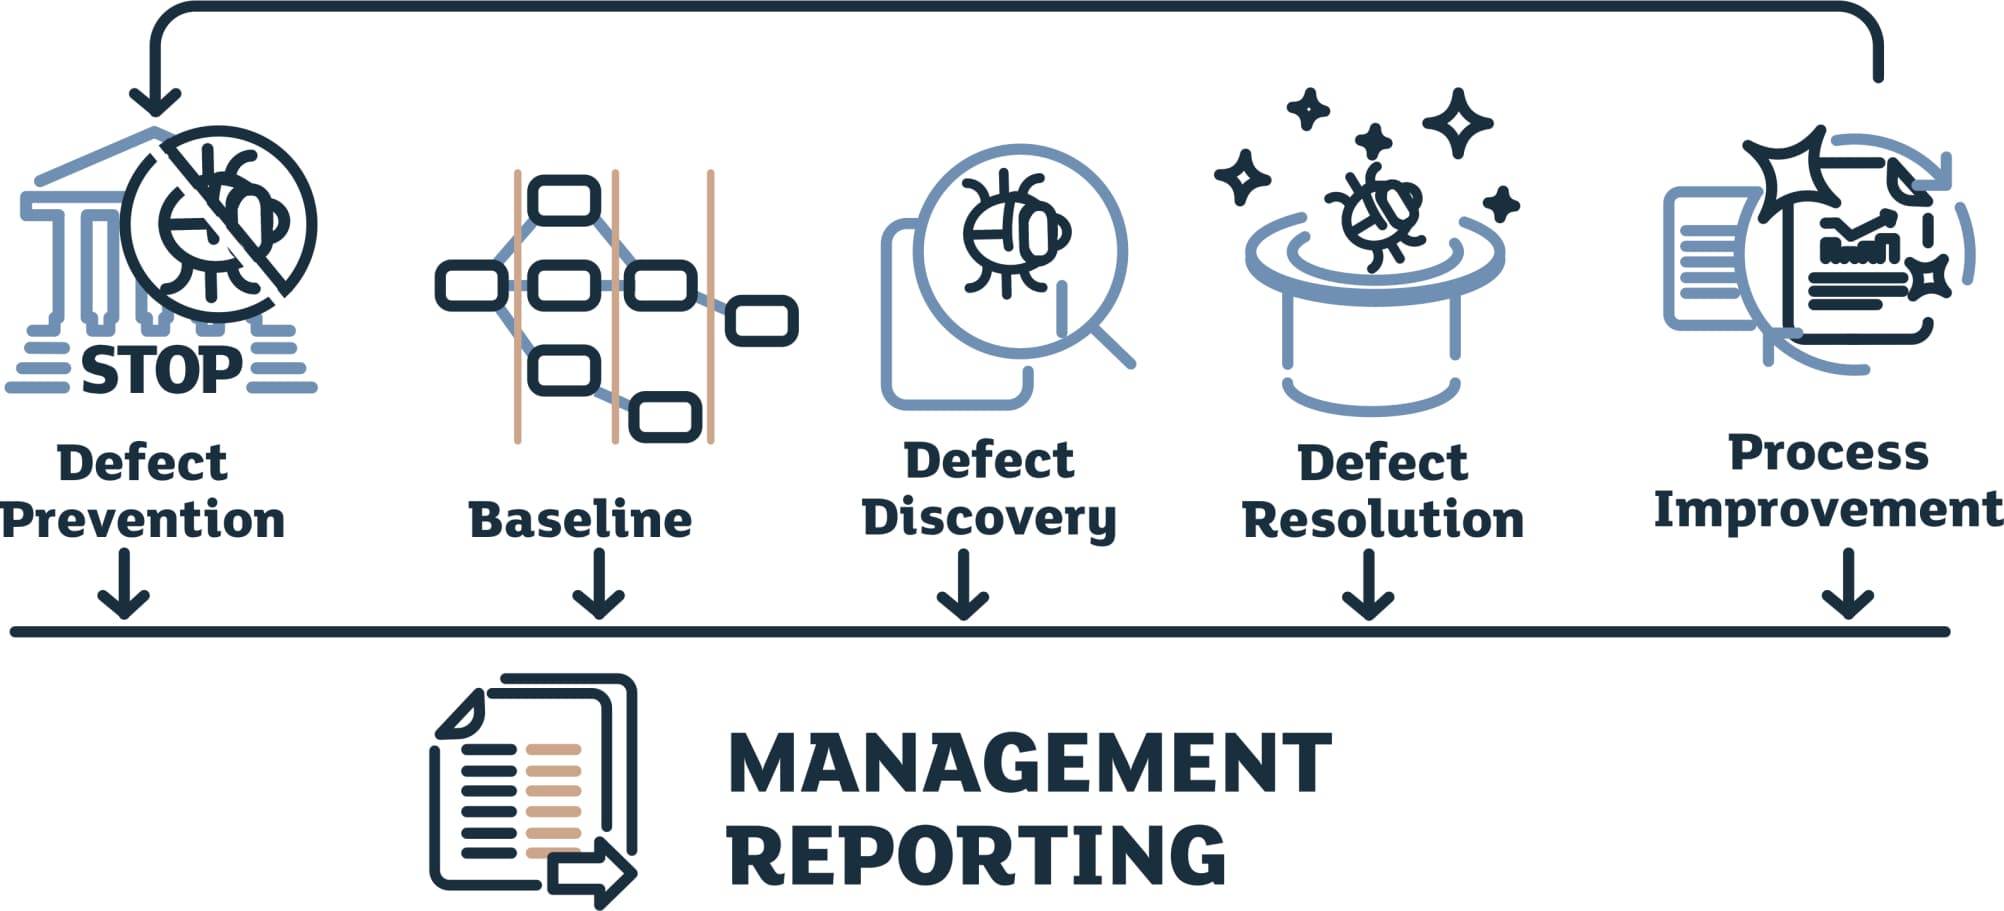
The second one is verification of the technical stability. Defect management is an essential part of improving the reliability of software via test tools. In their research, the Quality Assurance Institute states that defect management consists of six elements: discovering a defect, defect prevention, baselining, defect resolution, process improvement, problem reporting.

Defect management is crucial because software defects cost billions of dollars. For example, the National Institute of Standards and Technology (NIST) estimated that software defects cost the U.S. economy around $60 billion a year. The NIST study also found that identifying and correcting these defects earlier could result in up to $22 billion a year in savings.
According to the “Review of Research in Software Defect Reporting”, there are five areas of research in defect management:
- Automatic defect fixing
- Automatic defect detection
- Metrics and predictions of defect reports
- Quality of defect reports
- Triaging defect reports
Our goal today is gaining a better insight into the metrics and predictions of defect reports. Creating and using metrics is an important task because they can help project managers to see a comprehensive picture of the general risks and prevent them.
Typically, software companies use bug-tracking systems (BTS) in order to manage defects. Structured information about defects is a big advantage of BTSs, in which a bug is represented as a set of attributes. Thus, such an application can help to gather data for our research, allowing us to accumulate statistics and use them for predictions and data analysis.
2. Approach and Related Work.
Surveillance Systems.

Most researchers in the field of surveillance systems, agree that, in general, the features of these systems can be divided into three categories:
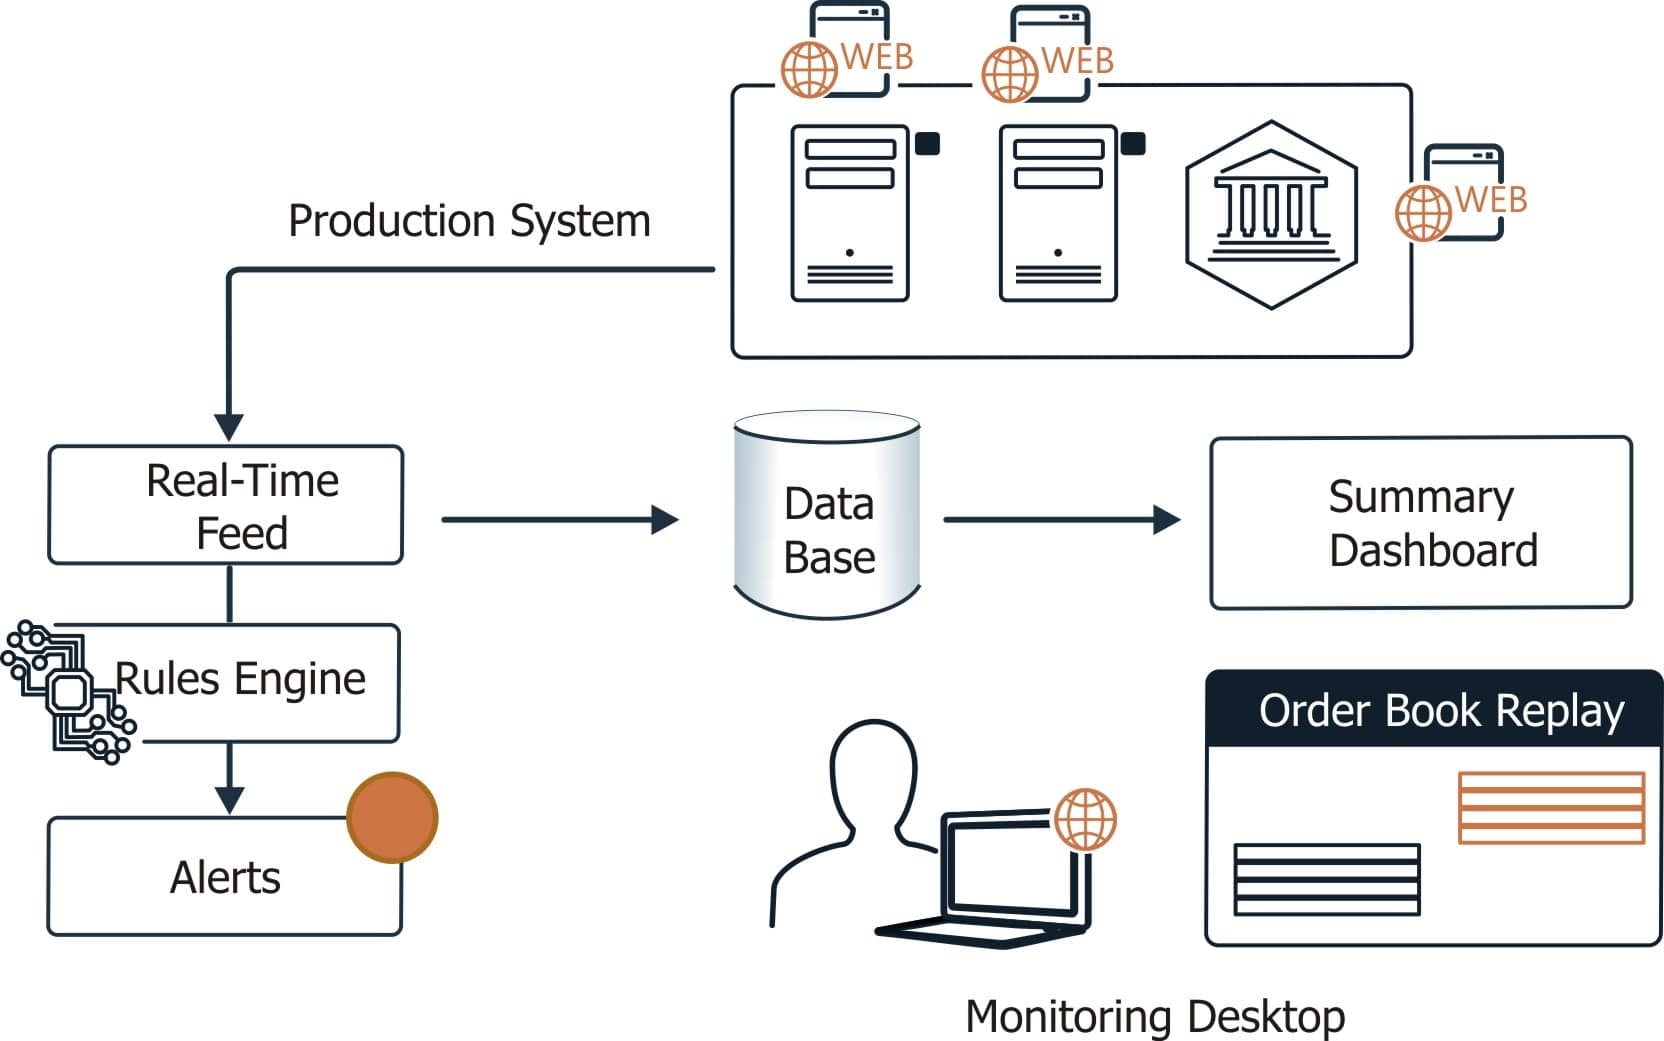
- Real-time analysis of features, to ensure full control on the exchange.
- Generating alerts by automatically identifying the transactions and events that led to the alert, real-time and offline.
- Offline market replay for deeper analysis of the clients’ behavior, to confirm or rule out its abusive nature.
Modern software suppliers of surveillance systems offer powerful products to analyze and report abusive behaviour in the context of volatile markets. These tools can process a high frequency data flow, monitor, store, and retrieve trade data, order data and market data, provide cross-market analysis, allow market replay, and so on.
As a result of the constant appearance of new tools and features, the modern market surveillance systems accumulate a huge volume of data. A lot of generated alerts, a lot of information about clients and their behavior need to be manually processed for decision making. So, on the one hand, modern features which are provided by the surveillance systems suppliers allow to perform deeper and better analyses of the market behavior, but on the other hand, the full volume of this information and alerts has to be processed more efficiently. This leads us to conclude that one of the weaknesses of the surveillance systems is a huge volume of untreated data. To solve this problem, we could apply data mining methods to this data, i.e. try to find some implicit dependencies or develop some rules for possible generation of managerial solutions.
Moreover, modern market is very unstable. Various new programs that both improve and abuse trading are developed on the daily basis. So, a necessity to adapt to the changing conditions is another problem. An ideal surveillance system needs to be able to singlehandedly predict the next generation of manipulation, as well as recognize and avoid the schemes of market abuse. It becomes clear that a modern surveillance system needs to be more adaptive and independent, and, thus, more manageable.
Data mining methods have been and are being widely used in finance. Researchers resort to different methods of artificial intelligence in order to predict price movements. They use deep neural networks for financial market predictions, echo state networks in order to predict stock prices, data mining techniques and a self-organizing neural fuzzy system for stock market dynamics modeling and forecasting. It is the general understanding that data mining methods are better suited for various forecasting in finance because they are more effective than statistical and charting approaches, which, like any standard methods, fail to consider the human factor in making decisions on the stock market. For the purpose of this paper, we would like to assert that we can benefit from data mining and the neural fuzzy systems in predicting market manipulations. This predictive model can provide more accuracy and interpretability of the results and eventually lead to automatic generation of managerial decisions.
Defect Management
According to the “Review of Research in Software Defect Reporting”, data mining and text mining methods are popular in defect management. Many researchers use different kinds of classifiers in order to predict the testing metrics, those include:
- Logistic Regression,
- Naive Bayes,
- Naive Bayes Multinominal,
- Support Vector Machines,
- Nearest neighbor method, etc.
Another reason why using text mining is popular is because some information like summary and description can only be found in the text fields. Depending on the tasks, different sets of attributes need to be defined in each case. However, in the “Survey Reproduction of Defect Reporting in Industrial Software Development” and “What Makes a Good Bug Report?”, researches agree on the most useful attributes from the point of view of the bug report quality, which are:
- steps to reproduce,
- stack trace,
- components,
- expected and
- observed behavior.
All of them are in text format. So the methods of text mining are suitable for defect processing for the purposes of classification or prediction. To further map these fields into a vector, in most cases, the scientists use the "bag of words" model via TF-IDF, as well as the natural language processing techniques, such as stopword removal, stemming, lemmatization and bigrams. All these methods and techniques allow us to solve a large class of problems related to bug reporting, including the prediction of different defect report attributes and testing metrics.
There are many kinds of testing metrics: time to fix, which defects get reopened, which defects get rejected, which defects get fixed, etc. The copious research in this field mostly investigates defects from open-source projects. These projects use BTSs in which a bug-report can be posted by anyone. Unlike those, our software is not open-source and our bug reports are only posted by QA analysts. Thus, the models elaborated in these papers do not suit us because we have other features. There is similar research in commercial software (Windows operating system), but this predictive model lacks some attributes which are relevant to us. So we would like to select another set of attributes and build other predictive models.
In order to use some kinds of metrics, we need to evaluate the full array of bugs. However, a project can have thousands of defects, making it difficult to process all the bugs. Cluster analysis, allowing to compress data by grouping a set of objects in a cluster, is a beneficial solution to this problem. Grouping defects can help us understand software weaknesses and improve the testing strategy, among other benefits.

We require the following attributes for clustering bug reports: priority (the absolute classification for many tasks), status, resolution, time to resolve (indicator of how expensive a bug report is), area of testing, count of comments (that is a proxy for some notions of popularity). However, some kinds of defect attributes are defined implicitly. For example, time to resolve or the area of testing. Time to resolve is the count of days that are necessary for bug reports to be resolved. Area of testing is a group of software components. Usually, the “Component/s” field contains the information about them, but sometimes this field can be empty or may lack some necessary elements. In that case, the “Summary” field will be useful because it has brief information about the bug. We need the “Summary” and the “Components” fields in order to classify the defects by the area of testing.
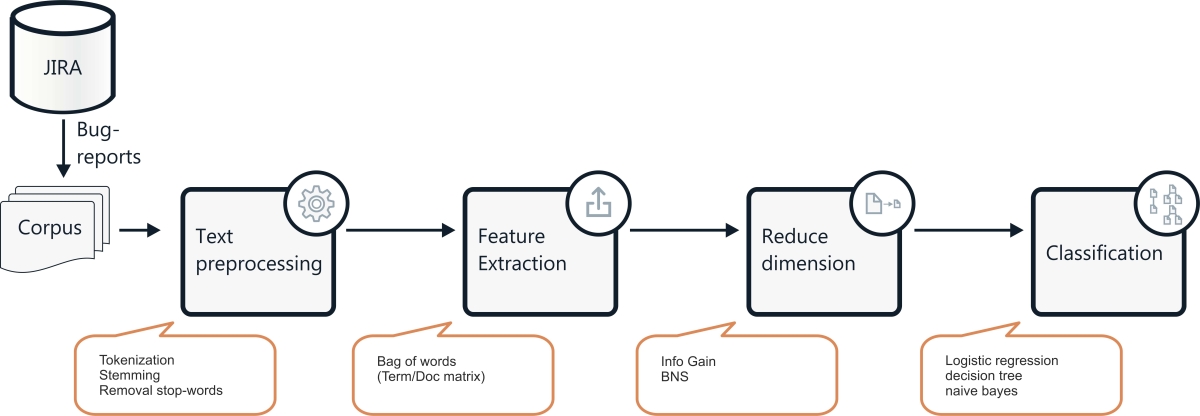
Every bug belongs to one or several Areas. For example, on our GTP project, we defined eight Areas of testing. Subsequently, a knowledge engineer attributes labels to each area and to each defect. The marked data is used as a training set. Thus, document (every defect is a separate document, a set of defects is a corpus) classification consists of the following steps:
- tokenization,
- removal of stop-words,
- stemming,
- using the “Bag of words” model via TF-IDF,
- reducing dimensionality via InfoGain,
- using the (training + testing) logistic regression model, decision tree and naive bayes (there is a separate model for each class),
- comparing the results via precision-recall metrics.

The steps were partly performed in WEKA. After classifying the defects by area of testing, we need to use cluster analysis. We propose to use different algorithms of clustering and compare the results.
The next task is working on predicting the “which defects get reopened” metric. This metric works as an indicator of software weaknesses. According to “Characterizing and predicting which bugs get fixed: An empirical study of Microsoft Windows”, the reasons of defect reopening are:
- bug report having insufficient information,
- developers misunderstanding the root causes of defects,
- ambiguous requirements in specifications.
Using metrics which evaluate the reopened bugs allows to define the weaknesses in testing, characterize the actual quality of the bug fixing process, as well as define the weaknesses in documentation.
3. Conclusions and future work
- Intelligent procedures of the complex analysis need to be implemented in the surveillance systems.
- Clustering is a way to understand and evaluate the full array of bugs. Linguistic information of bug reports is important for analysis. Text fields require using text mining in order to define different defect indicators (area of testing, level of usefulness, etc.)
The focus of our Future work
- Prediction of manipulations by the neuro-fuzzy model
- Clustering of bug reports and prediction of the “which defect get reopened” metric.
