Date:
PDF Version: Download
1. Introduction
The term TestOps is not widely used, and everybody interprets it differently. Some define TestOps as using the production system as a test environment, where the new software is installed on a limited amount of exposed production servers. The main advantage here is that the exposed users generate a variety of input signals providing a huge number of possible cases, which is almost impossible to reproduce in the testing environment. However, these few exposed users end up paying for the overall quality of the product. This approach is acceptable for non-critical and widespread services like social media that have millions of users, most of whom do not even notice that they are production testers. Even though a small percentage may notice some misbehavior, they ‘suffer’ for the greater good, and, globally, all the users get a better service.
2. TestOps at Exactpro
Is this approach acceptable for exchange testing? It is obvious that, because of regulatory compliance, we cannot give certain production users access to the software under test. Which means that all our production users at once must be provided with a full and high-quality service.
So, the notion of the TestOps environment at Exactpro implies creating a production-like environment that must be fully controlled by the company’s specialists and have the same monitoring and operating instruments as the production environment.
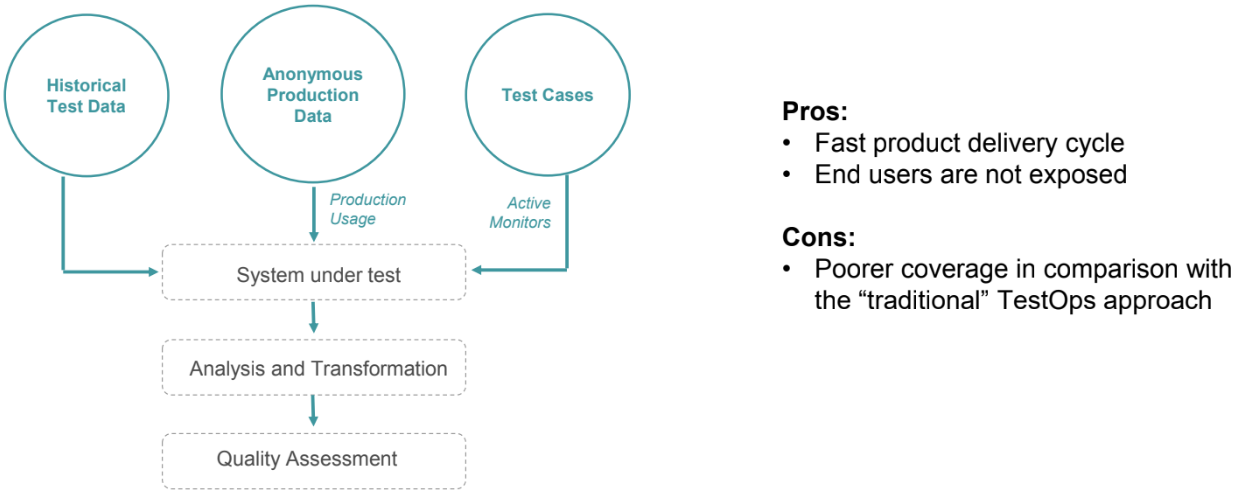
It is possible to use the accumulated historical testing data for result comparison, but since the testing does not happen in a real production environment, QA analysts need to simulate production-like input from users. For that purpose, they use anonymous production statistics and update the load accordingly, with controlled deviations. Testing with artificial data in the lab does not show the real behavior of the system under load. But what does a “production-like” environment mean?
3. A Production-like Environment
The production environment is not easy to recreate. Should we keep exactly the same configuration and restrict access to testers only? Should we be afraid of testers doing things that may break the environment? Should we wait for help from system operations when something goes wrong?
A ‘production’ environment needs to be available and add value 24/7. The main value for QA is data. ‘Availability’ here is understood as having an ability to bring the system back on at any time and continue testing. The system may crash at any time, unlike the real production environment, and that is a part of the testing process. Sooner or later, every piece of software will break. But it’s the absence of adequate monitoring that turns a problem into a disaster. Having the same monitors as system operations does not guarantee detecting every issue. Some alerts may not be set up for a number of reasons, for example, not to overwhelm the operator, but they may be important for testing purposes.
Exactpro QA Analysts use their own backup monitoring system not only to check the messages they found important, but for automation reasons as well. Another advantage of having backup monitoring in all of the company’s proprietary environments is that the data can be collected in the same format to be easily stored for future use.
4. The Process Flow
Once the new product build is delivered, all the testing tools and environments must be ready to go.

Testing tools and scenarios must be developed and updated in parallel with the product they test. The testing data must also be regularly updated. A change in the production users’ behavior or the reference data may reveal an unexpected problem. So, test scenarios must also take this change into account.
5. Test Tool Delivery and Environment Setup
It is crucial to have the ability to change the system configuration step by step to find the potential issue. Was it a change in reference data or in the new binary, or a combination of other factors?
Picture 3 illustrates a standard deployment process practiced at Exactpro. The test cases are updated using data from Jira and immediately uploaded into the version control system, so it’s always clear when the test case was updated and why.
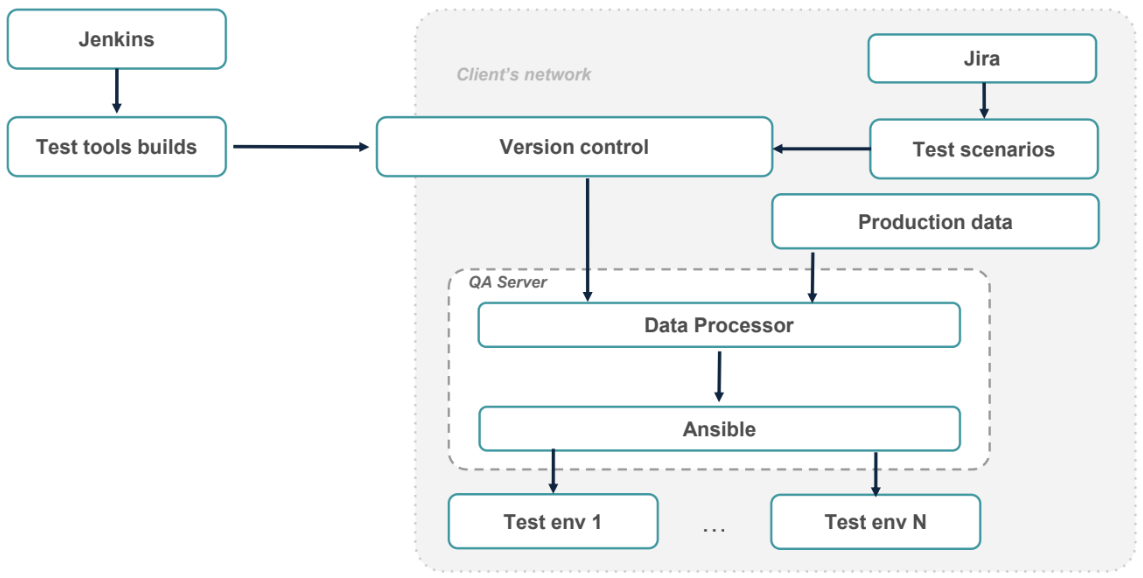
All the main tools are uploaded securely into the same version control system by Jenkins.
In the client's private network, all the data and tools are downloaded to the company’s QA Server and updated in accordance with fresh production data. Then, they can be managed by Ansible responsible for deployment and the environment setup.
6. Testing. High Touch and Low Touch Testing
Once deployment is completed, testing can be started immediately. Since there’s always a time limit, the system must not be idle, which is impossible with human-run tests: analysts spend time checking all pre- and post-conditions and analysing results, and they can not work 24 hours a day. Moreover, they spend more time on test execution than on test analysis and improvement. It leads to the testing process stagnation.
The standard high touch testing process makes QA analysts work under the pressure of hundreds of conditions they should take into account. The main advantage, though, is that analysts might notice the same things as system operators or rely on their experience to rerun a controversial test.
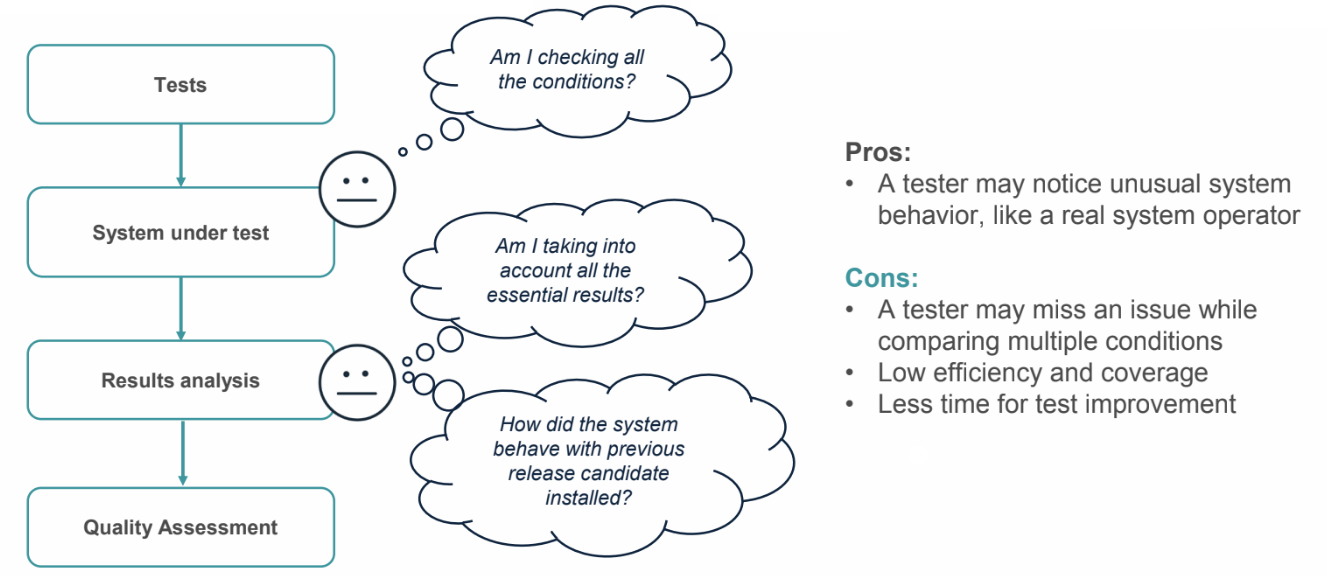
It would obviously be beneficial to have a test management tool which would check the current state of the system to decide what kinds of tests must be executed and when. That would save human resources and leave time for test improvement.
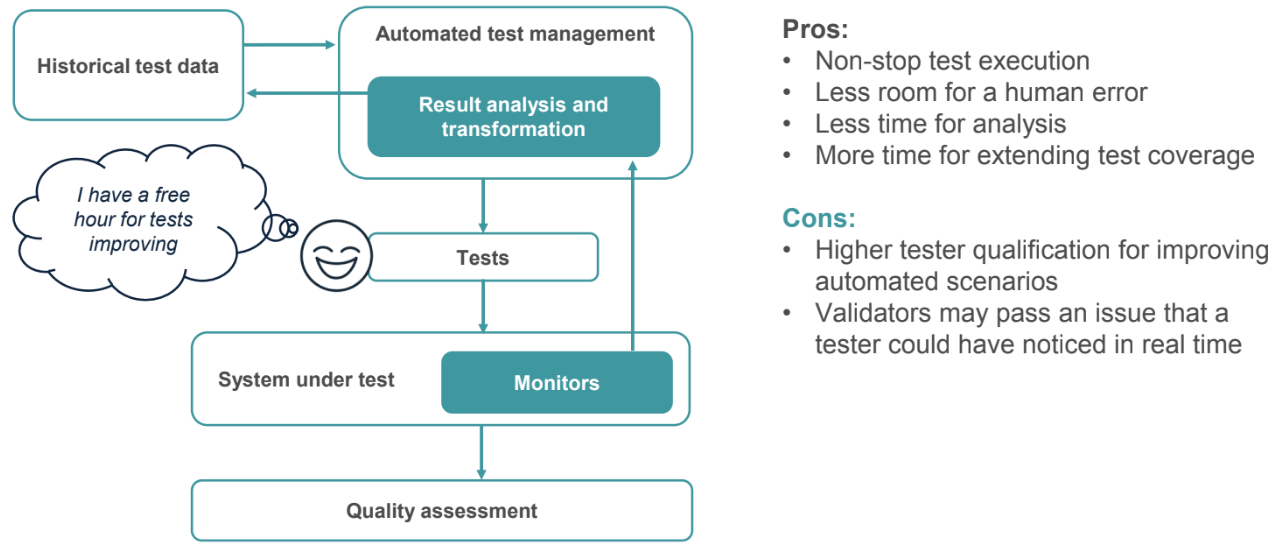
The ideal solution is a combination of both methods, where the analysts monitor the system using the tools available to system operators, but do not execute the tests and have an opportunity to compare their observations with what the automated tool provided.
7. Automated Test Management
Test scenarios must be transparent and user-friendly. The QA analyst is not supposed to write complex scripts for scenario execution, since that may become a problem for issue analysis. The complex logic must be isolated from the end user. One scenario must be executed in different environments without drastic changes. For that purpose, Exactpro analysts have developed a framework for testers.
8. Test Scenarios
Let's take a look at a simple scenario: an abstract command like `exec_smoke` is what the analysts should use. They should not be bothered by thinking of what kind of scripts they must execute in a particular environment and what kinds of parameters they must accept.
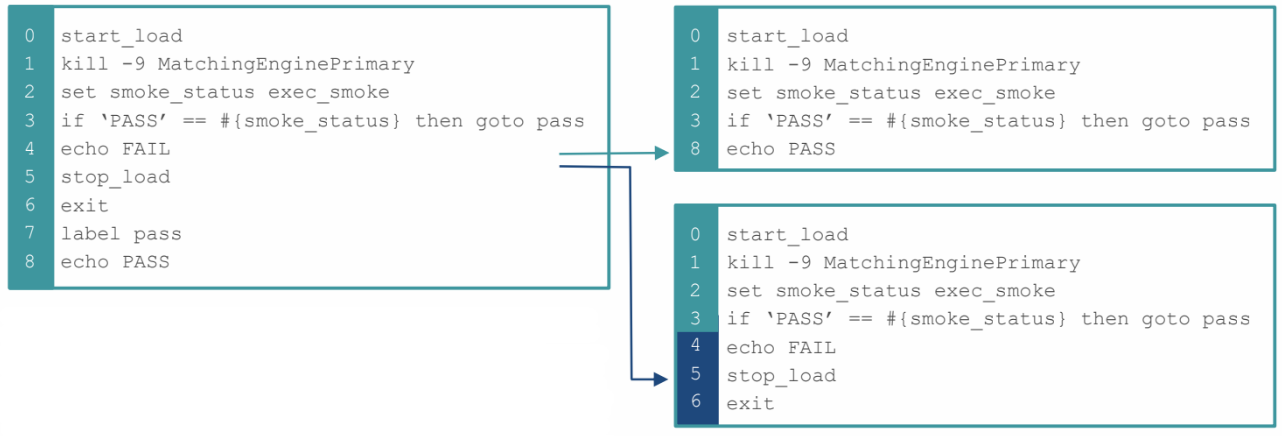
Every scenario consists of a sequence of such commands. This scenario can be easily formalized, unlike a complex script for machine analysis. The interpreter executes all the commands one by one. This is very convenient for semi-manual testing, where the user can enter a couple of commands and check the result. It must be said, though, that commands themselves are quite complex scripts, and they need someone to maintain them. The functionality may be extended with plugins written in Python, so where the `exec_smoke` command is provided with one plug-in, in another environment, it may be provided with another plug-in, while, for the end user, the overall logic remains the same.
9. The Monitoring Network
Scenario execution means nothing without monitoring. In addition to the existing monitoring, Exactpro QA Analysts deploy the company’s proprietary tools to get the system status. When working in a production-like environment, it is preferable to have a lightweight and system-independent solution that can easily adapt to the analyst’s needs, as opposed to having to rely on environment-specific system tools and libraries, or installing a runtime. To make things worse, some of these environments don’t even allow adjustments necessary for QA to perform their job most efficiently.
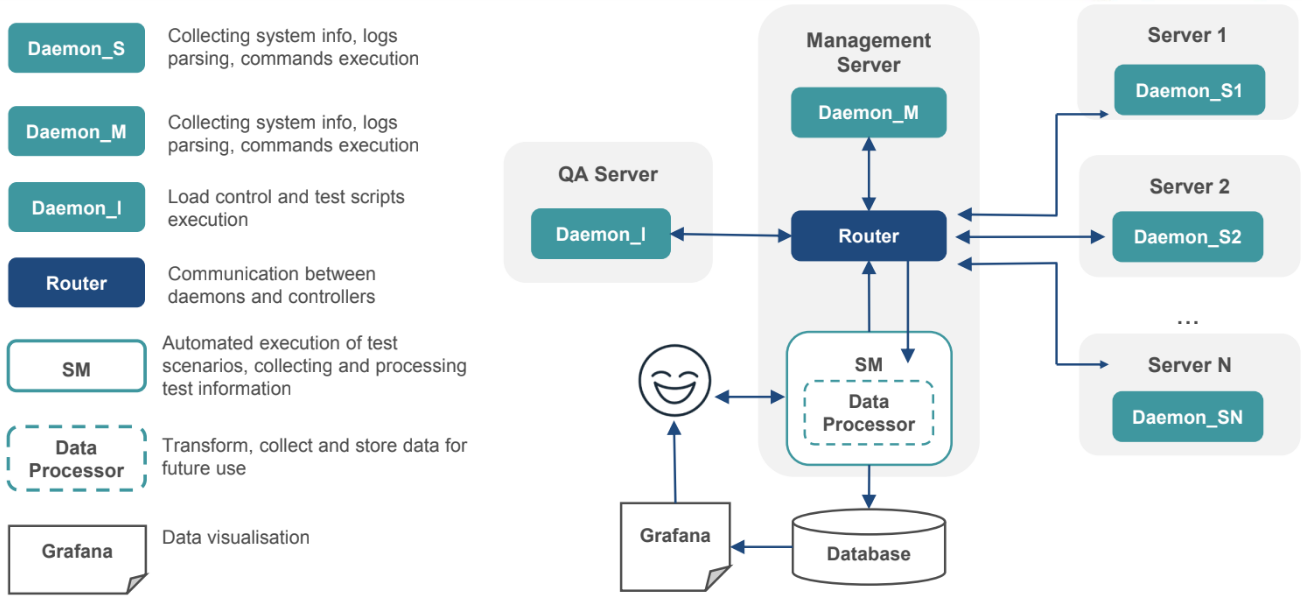
QA analysts run a daemon on every test server, which is responsible for parsing logs in real time and gathering the system metrics. All the messages are redirected to the router that collects and processes all the data and delivers it to clients. A client, in our case, is a ScriptManager tool and its data processor that converts and stores the data for future use in the database. The user can analyze data offline using Grafana or any other visualization instrument. The ScriptManager itself uses this data to decide whether the next command may be executed or not, or to check the status of the previous command.
10. Data Gathering
Let’s assume that there is a MatchingEngine server and a System Monitoring server that logs all the system events and metrics. The daemons collect the system info like CPU usage, disk space, memory utilization, network load, and parse system logs in real time.
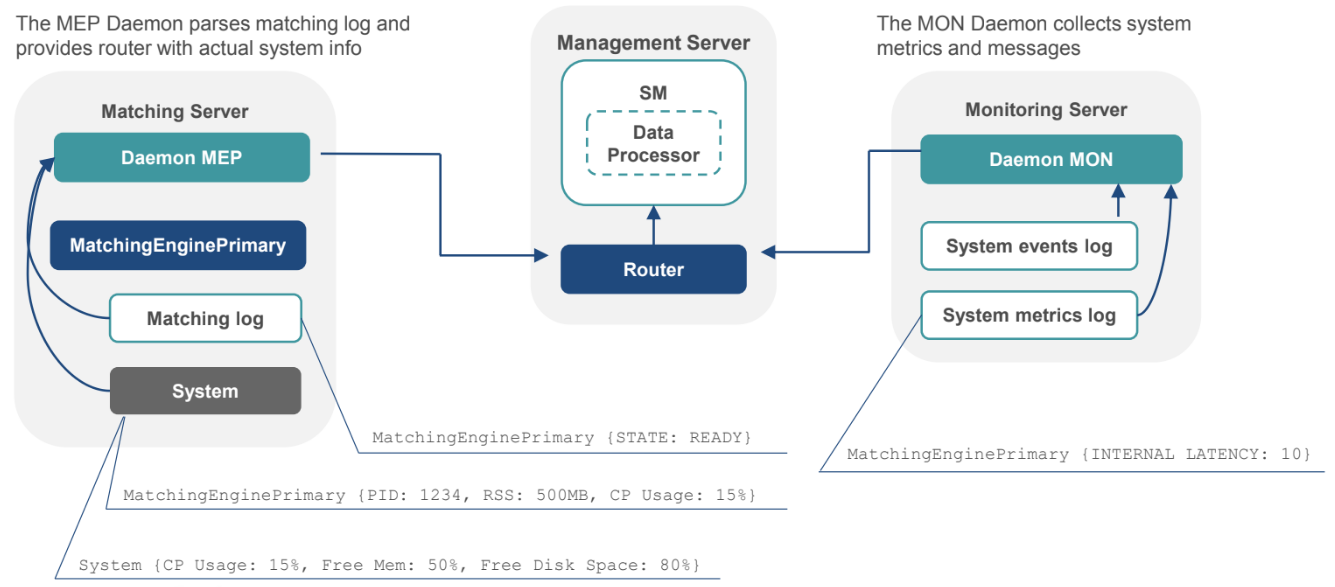
The module connected to the script manager receives all the data needed to provide the complete picture of the current state of the system.
11. Command Execution
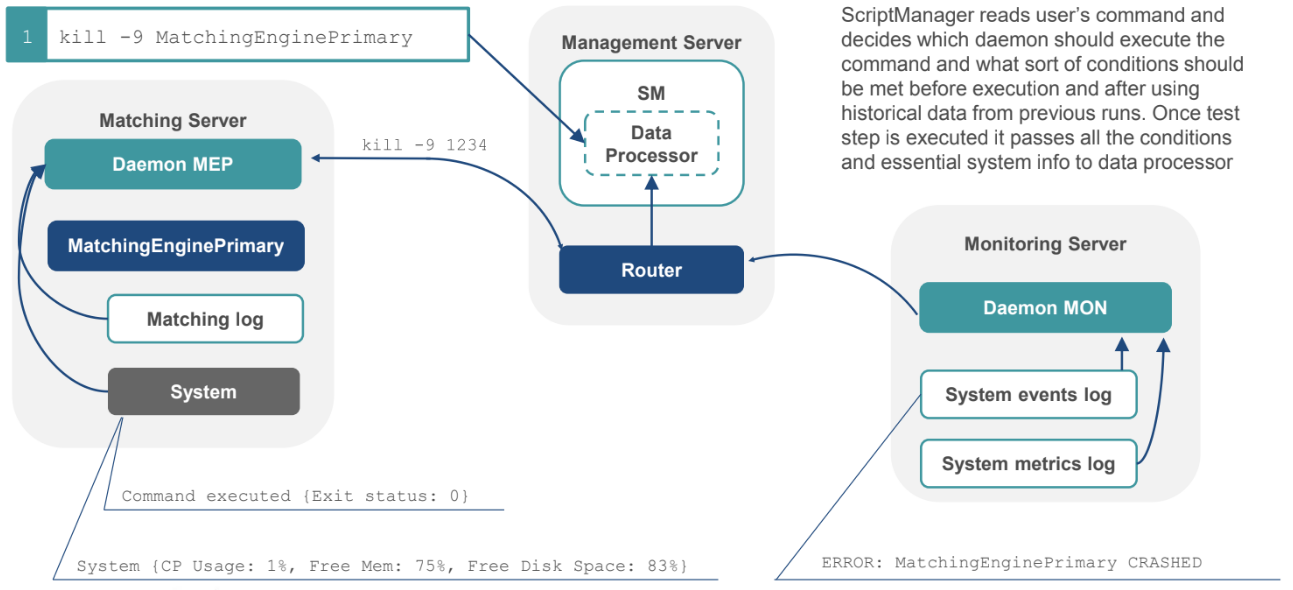
What happens when the user enters a command: the ScriptManager checks the conditions, for example, that the process is up and operating properly, then it passes the command to a daemon. The daemon confirms that the action is completed, when the manager processes all the related messages it received during the test step. It may raise an alert about another system component being down or about receiving an unknown warning from the log.
12. Behavior Analysis
For now, all the required conditions are defined by the users: the alert limits for the essential metrics, the system event triggers, and others. Historical data is used for post- processing only when the test is completed. Unfortunately, describing all the possible test input and output signals for result comparison cannot be done by humans efficiently. Therefore, Exactpro specialists are putting their efforts into collecting as much testing data as possible for machine learning, to enrich our scenarios in the future.
